Comprehensive Waste
Management
Ecopetrol participates in all the links of the hydrocarbon chain: exploration, production, and refining, which mainly generate water-based drilling cuts, oily sludge, construction and demolition waste, and metal scrap, among others.
Ecopetrol has drawn up a roadmap for its transition towards the Circular Economy, declaring itself as an enabler to close the materials and waste cycle. This contains goals for the reduction and use of waste and the certification of the zero waste management system, which will contribute to leveraging circularity metrics.
The adoption of the zero waste management system implies executing actions based on operating excellence for the comprehensive management of the waste generated, focusing on the adoption, use, and treatment thereof to prevent it from ending up in final disposal (landfill sites or secure landfills). The foregoing, to comply with the purpose of “progressive reduction of waste going to final disposal by 2040” and to advance towards the business ambition of circularity.
Policies and Commitments
Comprehensive waste management is one of the pillars in Ecopetrol’s environmental strategy. This pillar leverages and includes the adoption of operating and organizational measures to reduce the waste generated to economically and technically feasible levels, in terms of quantity and level of hazard, based on three (3) fundamental aspects:
1
Reduction at the source or at the origin.
2
The recovery of materials using waste, through the implementation of the Multi-R or 9Rs concept of circular economy.
3
The incorporation of technologies in strict compliance with the national regulatory framework and Ecopetrol’s internal procedures.
How is it Managed?
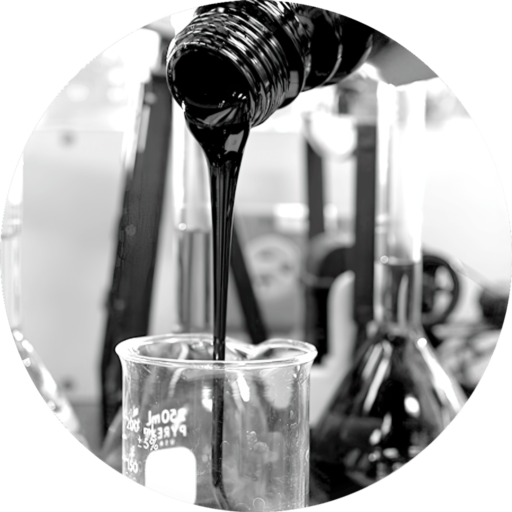
47% of hazardous waste is oily sludge generated especially by production and refining activities. Within the framework of the strategic pillar of Comprehensive Waste Management, and based on the provisions established in the Comprehensive Waste Management Guide, the following actions are implemented upstream:
Identification of initiatives to reduce the generation of oily sludge.
Environmental criteria for the selection of suppliers.
Inclusion of contractual green clauses to avoid waste generation or allow the reduction or use thereof.
Life cycle analysis.
Similarly, the following actions are executed downstream:
Centrifugation for the recovery of oils from the sludge, and reduction of the volume and hazard thereof.
Co-processing heat treatment for the sludge to be included as part of the fuel material in cement kilns, in order to destroy substances that cannot be treated or confined.
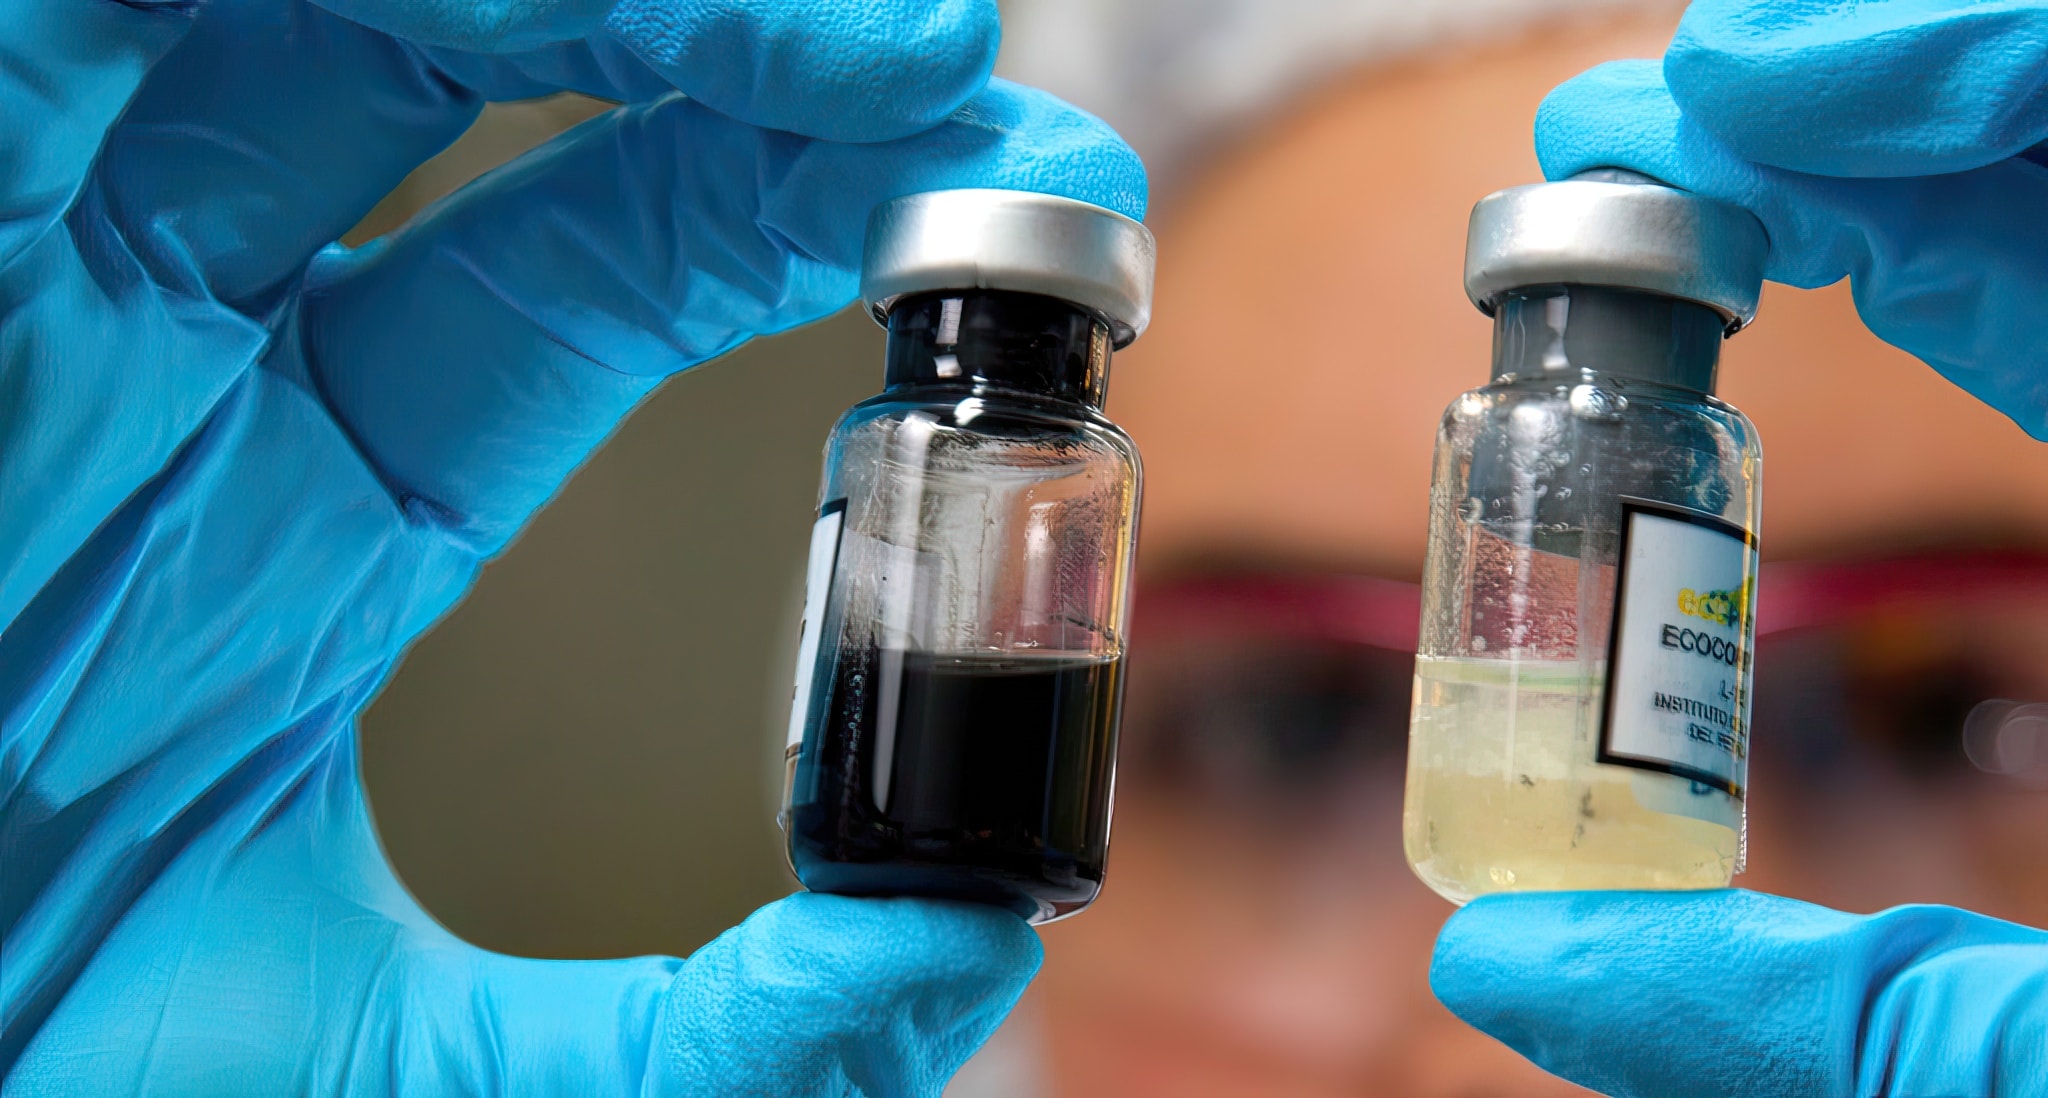
Sludge treatment using the bioremediation technique, which accelerates the total or partial degradation of the pollutant by reducing its concentration to a harmless state.
An alternative would be disposing of it in security cells in case the waste cannot be treated and requires special confinement.
Life cycle analysis.
The treatment and disposal activities above are conducted by third parties holding an environmental license and that are subject to monitoring and control.
Short, Medium, and Long
Term Goals and Projects
The following goals have been defined for the period of 2022-2024 as part of the purpose of progressively reducing the waste going to final disposal and the strategic lines of the comprehensive waste management pillar, in order to achieve the ambitions set:
Vice Presidency of Development and Production
11.3% reduction in category Y9 oily sludge waste.
Use of 84% of hazardous waste, not including category Y9 oily sludge.
6% reduction of hazardous waste other than oily sludge.
Use of 94% of non-hazardous waste.
9% reduction in non-hazardous waste.
These reduction and use targets were estimated based on the number of tons generated in 2020.
Vice Presidency of Refining and Industrial Processes
Use of 15% of category Y9 oily sludge waste.
Use of 15% of hazardous waste, not including category Y9 oily sludge.
Use of 5% of non-hazardous waste.
Of the objectives above, the Company used 38% of the total waste generated in 2022 compared to the country goal of 30% by 2030. In addition, the following activities were undertaken:
Laboratory tests for the reuse of used mineral lubricating oils to obtain the lubricant base in specifications.
Pilot project for the reuse of construction and demolition waste for the paving of internal roads at the Cartagena refinery.
Feasibility studies and characterization of clarified sludge to be used in amendments or construction products.
The evaluation of two pyrolysis oil technologies, at the pilot plant level, to obtain the monomer and ensure the delivery of refinery grade propylene (pgr) to Esenttia within the plastic waste to monomer project.
Progress will also be made towards circularity, leveraging on the results obtained in 2022:
- Organic waste composting – circularity index 72%.
- Sale of metal scrap waste to steel companies – utilization rate 99%.
99% of the planned milestones were met in 2022, which leverage the achievement of the goals established for 2024.
To prevent waste generation from the organization’s own activities and from upstream and downstream activities in the value chain, Ecopetrol deploys the following actions:
Waste prevention and reduction measures are adopted upstream:
Environmental criteria for the selection of suppliers.
Inclusion of contractual green clauses to avoid waste generation or allow the reduction or use thereof.
The following actions are implemented downstream:
Use of: wood from pallets and crates in warehouse operations; debris from road maintenance and gully filling; non-hazardous catalysts from cracking units.
Management plan for single-use containers and packaging for packaged products placed on the market.
Use of: construction and demolition waste in industrial aggregates, clarification sludge (PTAP), and water-based cuts in construction.
Chemical leasing available for the chemical treatment service to return surplus products and packaging to suppliers.
Post-consumer agreements: handing over electrical and electronic equipment, lighting fixtures, and lead acid batteries to waste suppliers.
Composting of organic waste from catering and food services – circularity index 72%.
Sale of metal scrap waste to steel companies so that it can be reincorporated into their production processes – Use of ferrous waste: 99%.
With respect to oily sludge, the following actions are available for both streams:

- Production
Technologies to minimize the amount of fluid in the sludge, such as dehydration and centrifugation processes for oil recovery. - Refining
Sending oily sludge to a third party that uses it by co-processing in cement kilns (Clinker production). - Refining and Production
Research is being conducted on the use of efficient emulsion breakers in production wastewater treatments that prevent the generation of oily sludge and use the sludge as asphalt binders.
In accordance with the Comprehensive Waste Management Guide and the document on Good Practices for Sustainable Supply, compliance with third-party contractual and legislative obligations is ensured based on the following considerations:
Technical specifications, including regulatory environmental obligations, description of the required service, and contractual obligations.
Environmental criteria for the selection of suppliers.
Implementation of the processes specified in the contracting manual for the selection of the third party service provider.
Market intelligence, showroom, definition of the criteria and requirements of the service, and the technical and commercial evaluation of the bidders.
Green clause.
Verification of environmental licenses authorizing the treatments and/or utilization processes and final disposal, issued by the competent environmental authority.
Verification of the third-party environmental permits or authorizations required for the development of the activity (discharge and water concession permit), if necessary for the treatment process offered.
Visits to third party facilities to verify and ensure that the waste treatment processes and infrastructure offered are aligned with the provisions set forth in their environmental license and confirm that they fulfill the requirements for treatment.
Follow-up using the External Waste Inspection Form indicated in Ecopetrol’s Comprehensive Waste Management Guide.
Monitoring the effectiveness of the action and improvement plans against the findings resulting from evaluations, audits, inspections, behavior assurance processes, incident investigations, among others.
Implementation of the performance procedure for contractors GAB-P-013. Verification of criteria associated with operational incidents involving environmental impacts, compliance with HSE obligations, best HSE practices, and high-potential events.
The information on the waste generated in the different operating and administrative areas of Ecopetrol, from the generation site to its disposal, is collected by using the SIGAR-Residuos computer tool, which allows the comprehensive management of Ecopetrol’s waste to track the amounts generated by each waste stream. This information is obtained via reports from contractor companies that conduct activities in the industrial facilities and by the supply area responsible for the operation of non-industrial facilities. The report includes a consolidated file with transport certificates and information on the final disposal of the waste.
The SIGAR-Residuos tool facilitates the evaluation of hazardous and non-hazardous waste management for the timely identification of opportunities for improvement, the submission of reports, and to manage the documentation supporting the legal efforts exerted. The information contributes to the adoption of decisions for continuous performance improvement and provides data for the preparation of sustainability reports.
Ecopetrol is currently working to continuously improve the reliability of the information; this can increase the amounts reported due to the inclusion of new waste categories and the correction of the data. In the same way, the incorporation of new operating fields and projects in each term increases the amount of waste generated. In 2022, 21 new generators were entered into the database.
According to SIGAR user guides, the operating component of the information upload process assigns roles to consolidate and validate the information submitted by the parties executing waste management activities before uploading it into the tool.

For 2022, the target for non-hazardous waste generation was 262,834 metric tons and 184,554 metric tons for hazardous waste.
(GRI 306-3, 11-5-4) (WEF 17) (TCFD M-1.2.2)
| Waste generated | Unit of measurement | 2019 | 2020 | 2021 | 2022 |
|---|---|---|---|---|---|
| Hazardous waste | TonM | 203,833.42 | 140,434.13 | 137,375.67 | 188,711 |
| Non-hazardous waste | TonM | 211,506.16 | 157,700.91 | 199,716.89 | 270,378 |
| Total waste generated | TonM | 415,339.58 | 298,135.04 | 337,092.56 | 459,089 |
Note 1. In 2022, the waste generated amounted to 459,089 tons, of which 188,711 tons correspond to hazardous waste and 270,378 tons to non-hazardous waste; this represents a 27% increase in generation compared to 2021, mainly due to greater generation of the following residues: water-based drill cuttings, oily sludge, debris, hydrocarbon contaminated soils, metal scrap, and oily drill cuttings. This increase is directly related to increased well drilling (183 wells in 2021 and 262 wells in 2022), in addition to scheduled maintenance activities in the pools and tanks at the Barrancabermeja refinery; an increase in oily sludge, due to greater removal of total suspended solids in production waters reused in reinjection activities for recovery; larger amounts of hydrocarbon-contaminated soils deriving from the recovery of contingencies in the last quarter of 2021 and 2022, and an increase in metal scrap from dismantling activities.
Note 2. Hazardous waste generation recorded a 27% increase in 2022, as well as non-hazardous waste with a 26% increase compared to 2021, due to the considerations described in the paragraph above. The hazardous waste generated, from largest to least quantities, are: Oily sludge, hydrocarbon-contaminated soils, and oily drill cuttings.
Note 3. In terms of the total amount of non-hazardous waste generated, the most representative ones are: water-based drill cuttings, debris, and metal scrap.
Note 4. The Company’s waste management information is available in the SIGAR-Residuos tool, used to monitor the amounts generated by each waste stream.
(GRI 306-3, 11-5-4) (WEF 17) (TCFD M-1.2.2)
| Waste not intended for disposal | Unit of measurement | 2019 | 2020 | 2021 | 2022 |
|---|---|---|---|---|---|
| Hazardous waste | TonM | 92.29 | 3,883.72 | 6,105.84 | 19,845 |
| Non-hazardous waste | TonM | 201,320.21 | 31,863.13 | 47,565.51 | 52,496 |
| Total waste not intended for disposal | TonM | 201,412.5 | 35,746.85 | 53,671.35 | 72,341 |
Waste Not Intended for Disposal Based on Recovery Operations at the Organization’s Facilities. There are no landfill sites or waste disposal incinerators within Ecopetrol facilities.
(GRI 306-4, 11-5-5) (WEF 17E) (TCFD M-1.2.2)
| Waste not intended for disposal | Unit of measurement | 2019 | 2020 | 2021 | 2022 |
|---|---|---|---|---|---|
| Hazardous waste to be prepared for reuse | TonM | 9.63 | 3,103.01 | 6,074.62 | 17,922 |
| Recycled hazardous waste | TonM | 82.67 | 780.71 | 31.22 | 1,923 |
| Hazardous waste going to other recovery operations | TonM | 0 | 0 | 0 | 0 |
| Total hazardous waste not intended for disposal | TonM | 92.29 | 3,883.72 | 6,105.84 | 19,845 |
| Non-hazardous waste to be prepared for reuse | TonM | 52.13 | 12.95 | 0.094 | 9,486 |
| Recycled non-hazardous waste | TonM | 29,125.14 | 17,861.58 | 27,922.31 | 41,556 |
| Non-hazardous waste going to other recovery operations* | TonM | 8,281.94 | 10,830.53 | 6,223.11 | 1,454 |
| Total non-hazardous waste not intended for disposal | TonM | 37,459.21 | 28,705.06 | 34,145.514 | 52,496 |

| Consolidated waste not intended for disposal | Unit of measurement | 2019 | 2020 | 2021 | 2022 |
|---|---|---|---|---|---|
| Hazardous waste to be prepared for reuse | TonM | 9.63 | 3,103.01 | 6,074.62 | 17,922 |
| Recycled hazardous waste | TonM | 82.67 | 780.71 | 31.22 | 1,923 |
| Hazardous waste going to other recovery operations | TonM | 0 | 0 | 0 | 0 |
| Total hazardous waste not intended for disposal | TonM | 92.29 | 3,884.72 | 6,105.84 | 19,845 |
| Non-hazardous waste to be prepared for reuse | TonM | 163,913.13 | 3,171.02 | 13,420.094 | 9,486 |
| Recycled non-hazardous waste | TonM | 29,125.14 | 17,861.58 | 27,922.31 | 41,556 |
| Non-hazardous waste going to other recovery operations | TonM | 8,281.94 | 10,830.53 | 6,223.11 | 1,454 |
| Total non-hazardous waste not intended for disposal | TonM | 201,320.21 | 31,863.13 | 47,565.514 | 52,496 |
| Total waste not intended for disposal | TonM | 201,412.5 | 35,746.85 | 53,671.354 | 72,341 |
Note 1. In terms of hazardous waste to be prepared for reuse, the increase is related to a larger volume of oily sludge generated at the Barrancabermeja refinery, which is sent to co-processing to be used as fuel in cement kilns.
Note 2. In terms of recycled hazardous waste, a peak was recorded in 2020 associated with the replacement of lighting fixtures, battery replacement campaigns, mainly in the Rubiales field, and the dismantling of electrical and electronic equipment. 2022 presents an increase in the utilization of used lubricating oils.
Note 3. In terms of non-hazardous waste to be prepared for reuse, the variations in this item are directly related to the generation and use of water-based cuts; a peak was recorded in 2019 in civil, geotechnical, and gully filling works. Drilling campaigns are reduced in 2020, thus reducing the generation of waste. In 2021, the normalization of activities increased waste generation; however, cutting dehydration technology will be implemented as of this year and throughout 2022, which will substantially minimize the amount of waste. This initiative was deployed in the Central Region, Piedemonte, and in the Rubiales and Caño Sur fields.
Note 4. In terms of non-hazardous waste going to other recovery operations, the variations in the amounts of non-hazardous waste in 2022 compared to previous years, are due to increased efforts to separate waste at the source, such as wood, paper, and cardboard, to be subsequently delivered for use to the recycling chain.
Note 5. In 2022, the recovery rate for hazardous waste not intended for disposal stood at 11%, due to a 69% increase in the amount of hazardous waste not intended for disposal, especially associated with the reuse of 66% of oily sludge generated at the Barrancabermeja refinery as fuel in cement kilns.
The recovery rate for non-hazardous was 19% due to the recycling of metal scrap in the steel industry, recording a recovery rate of 99%.
Moreover, in 2022, 1,454 tons of non-hazardous waste were used in new internal activities, such as the composting of organic waste from food preparation and vegetable waste from pruning and brushing, to produce fertilizers and other by-products for internal use and to be given to stakeholder groups. Compost bins were installed within the facilities – 72% circularity index in food services.
With regard to plastic, glass, paper, and cardboard waste, it is worth noting that 96% is used thanks to its adequate separation at the source, so that it can be later delivered for use by recyclers and foundations. This information is obtained from contractor reports that conduct activities within industrial facilities and from the supply area responsible for the operation of non-industrial facilities. The report includes a consolidated file with transport certificates and final waste disposal information, and documents on reverse logistics, Chemical Leasing, composting, and post-consumer agreements.
(GRI 11-5-6, 306-5) (WEF 17E) (TCFD M-1.2.2)
Residuos destinados a eliminación
| Residuos destinados a eliminación | Unidad de medida | 2019 | 2020 | 2021 | 2022 |
|---|---|---|---|---|---|
| Residuos peligrosos | TonM | 203,741.13 | 136,550.41 | 131,269.83 | 168,866 |
| Residuos no peligrosos | TonM | 10,185.95 | 125,837.78 | 152,153.12 | 217,882 |
| Total residuos destinados a eliminación | TonM | 213,927.08 | 262,388.2 | 283,422.95 | 386,748 |
(GRI 306-5, 11-5-6) (WEF 17E)
Waste Intended for Disposal Based on Disposal Operations at the Organization’s Facilities.
There are no landfill sites or waste disposal incinerators within the Company’s facilities.
(GRI 306-5, 11-5-6) (WEF 17E)
| Waste intended for disposal | Unit of measurement | 2019 | 2020 | 2021 | 2022 |
|---|---|---|---|---|---|
| Hazardous waste to be incinerated (with energy recovery) | TonM | NA | NA | 0 | 0 |
| Hazardous waste to be incinerated (without energy recovery) | TonM | 5,754.86 | 2,599.72 | 461.45 | 773 |
| Hazardous waste transferred to a landfill | TonM | 6,012.07 | 30,209.79 | 6,034.52 | 7,096 |
| Hazardous waste going to other disposal operations | TonM | 191,974.2 | 103,740.91 | 124,773.86 | 160,997 |
| Total hazardous waste intended for disposal | TonM | 203,741.13 | 136,550.41 | 131,269.83 | 168,866 |
| Non-hazardous waste to be incinerated (with energy recovery) | TonM | NA | NA | 0 | 0 |
| Non-hazardous waste to be incinerated (without energy recovery) | TonM | 92.47 | 45.56 | 2.37 | 55 |
| Non-hazardous waste transferred to a landfill | TonM | 10,093.49 | 125,792.22 | 94,729.72 | 108,682 |
| Non-hazardous waste going to other disposal operations | TonM | NA | NA | 57,421.03 | 109,145 |
| Total non-hazardous waste intended for disposal | TonM | 10,185.95 | 125,837.78 | 152,153.12 | 217,882 |
| Total waste intended for disposal | TonM | 213,927.08 | 262,388.2 | 283,422.95 | 386,748 |
(GRI 11-5-6, 306-5) (WEF 17E)
In accordance with the provisions laid out in the Comprehensive Waste Management Guide, the management steps include an initial verification of whether the waste can be used. If it cannot be used due to its physicochemical composition or if there are no treatments available for it on the market, the waste is then sent for elimination or final disposal.
The main types of waste sent for disposal in 2022 were:
01
Water based cuts
02
Oily sludge
03
Hydrocarbon-contaminated soils
04
Oily drill cuttings

The data also include waste taken to co-processing and treated via bioremediation, such as oily sludge and hydrocarbon-contaminated soil , which account for almost 72% of the Company’s hazardous waste in 2022.
It is important to highlight that the bioremediation process is currently conducted at third-party facilities with an environmental license authorizing the execution of this type of activity.
The hazardous waste intended for disposal that is transferred to a landfill, such as elements impregnated with hydrocarbons and sludge with acid characteristics, is disposed of in a security cell or landfill.
The information on the waste intended for disposal such as oily sludge, hydrocarbon-contaminated soil, elements impregnated with hydrocarbons, catalysts, and others, is collected through the reports prepared by contractor companies that perform activities within the industrial facilities. The report includes a consolidated file with transport certificates and information on the final disposal of the waste.
In accordance with the performance indicated above, the below aspects can be highlighted:
1
According to the generation of waste not intended for disposal, there is an increase of 18,670 tons in the amount of waste used in 2022 vs. 2021, maintaining the percentage use over the total generated in the period (2022).
2
In 2022, the utilization rate for hazardous waste not intended for disposal stands at 11%, mainly due to increased shipments of oily sludge from the Barrancabermeja refinery as fuel for cement plants, and in terms of non-hazardous, the rate was 19% due to the recycling of metal scrap in the steel industry, which records a utilization rate of 99%.
3
Although the generation of solid waste has increase by 121,996 tons in 2022, as a result of a representative increase in activities (drilling and maintenance, among others), there is no percentage increase with respect to the waste intended for disposal, as shown in the following trend: 2020 (88%); 2021 (84%), and 2022 (84%).
4
In terms of waste reduction, it is worth highlighting the initiative deployed by the Central region, the Piedemonte region, and the Rubiales and Caño Sur fields to dehydrate water-based drill cuttings, which achieved a 67% reduction in the volume of waste generated.
Improved prevention and remediation
of impacts on the environment caused
by operational and process safety incidents
The strategic pillar of the environmental strategy, prevention and remediation of environmental impacts caused by operating and process safety incidents, incorporates a management program under the provisions of the ISO 14001 (V2015) standard, containing milestones and goals that are reviewed quarterly by the HSE Vice Presidency. This pillar focuses on the prevention of operating incidents affecting the environment, by incorporating proactive risk management and analyzing the potential materialization of environmental risks typical of the Company’s different businesses.
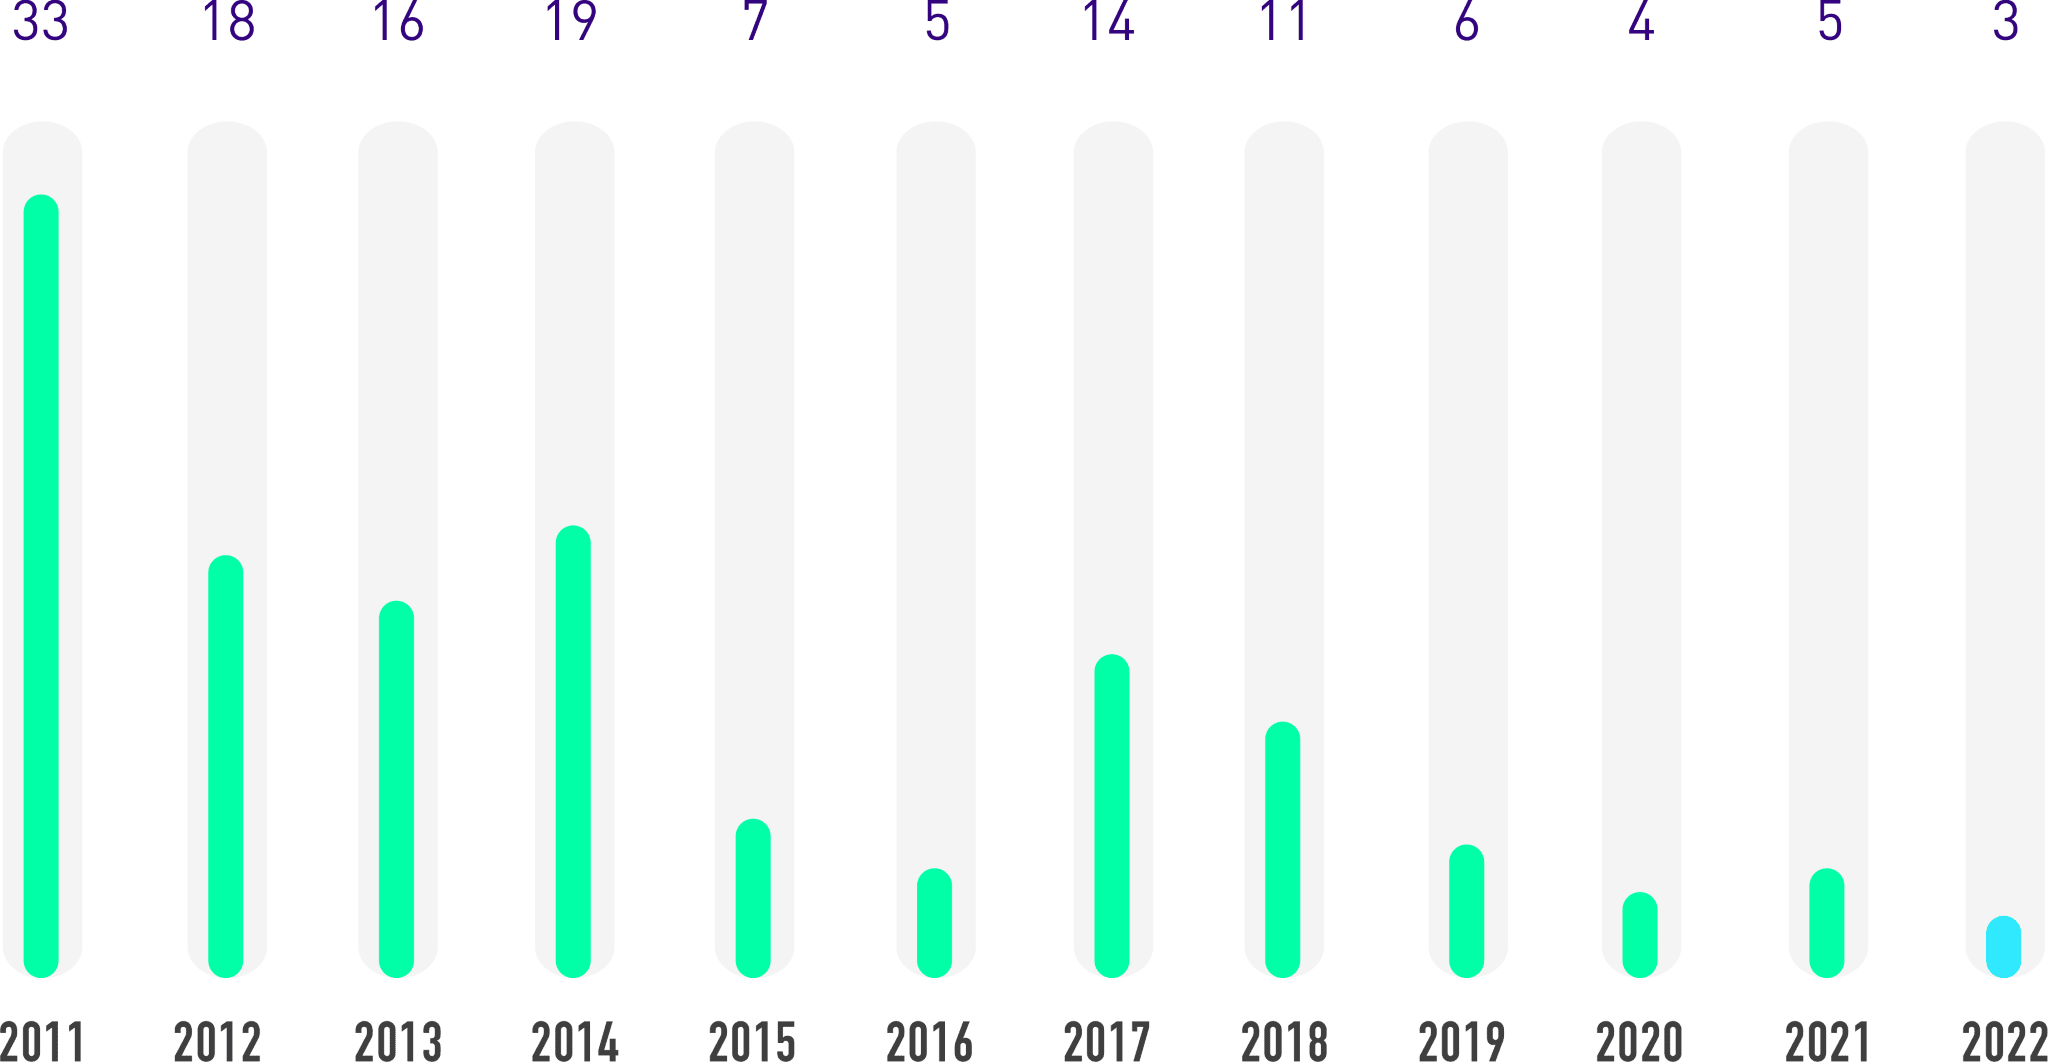
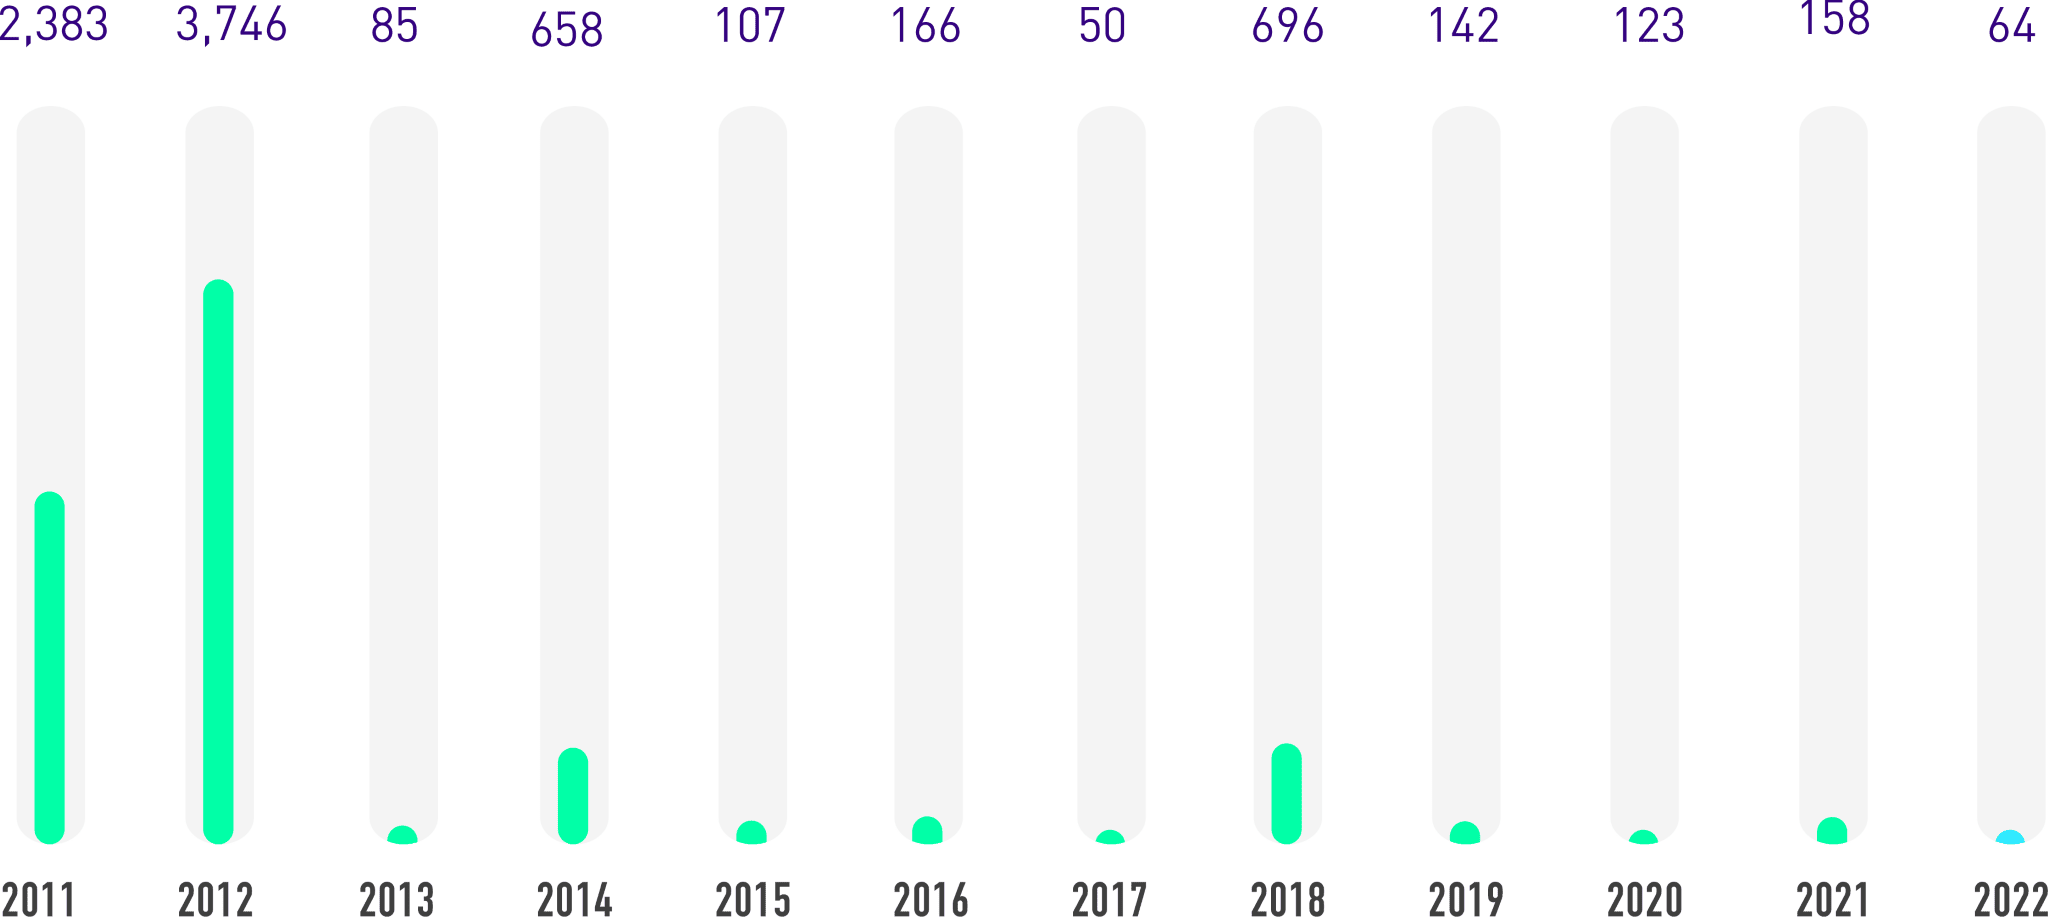
To monitor performance, Ecopetrol S.A. annually sets a limit for the indicator showing barrels spilled due to operating incidents affecting the environment. The limit established for 2021 was 128 barrels, and 117 barrels for 2022.
At the end of 2022, 63.7 Bbls of hydrocarbons spilled were recorded caused by operating incidents greater than 1 Bbl. This volume is 45.6% less than the limit established for this term, and 60% less than the barrels spilled in 2021, which is the best performance in the last five (5) years.
This is the result of the systematic execution of the integrity and reliability plans. In 2022, the Upstream Vice Presidency allocated roughly 27.7 million USD to replace 88.7 km of pipelines as part of the implementation of the integrity plans.
The following graphs present the 2011-2022 evolution of the information described above:
(SASB EM-EP-160a.2) (SFC XVI) (ECP 005)
| Spills | Unit of measurement | 2019 | 2020 | 2021 | 2022 |
|---|---|---|---|---|---|
| Total number of oil spills | # | 6 | 4 | 5 | 3 |
| Total volume of hydrocarbons spilled | bbl | 141.9 | 124.86 | 157.76 | 63.7 |
| Volume of spills impacting environmentally sensitive coastlines | bbl | 0 | 0 | 0 | 0 |
| Volume of spilled hydrocarbons removed from the environment | bbl | 0 | 0 | 0 | 0 |
Note 1. Data reported from the exploration and production segment of the hydrocarbons business line.
Note 2. The information reported in the table corresponds to operating incidents with volumes of hydrocarbon spilled greater than 1 Bbl. It is also important to mention that 12 incidents caused by third parties were reported in 2022, which affected the environment in volumes of hydrocarbon spilled greater than 1 barrel. The total volume spilled was 77.91 Bls.
Note 3. 100% data coverage.
Note 4. 63.7 barrels of hydrocarbons were spilled in 2022 due to operating causes (in incidents greater than 1 barrel), which is a 60% decrease compared to 2021. This value is below the internal limit of 117 bbls for 2022, the best performance in the last 5 years, thanks to the systematic execution of the integrity and reliability plans. Moreover, the environmental sensitivity component was improved as an input for the analysis of operating risk, in order to prioritize infrastructure interventions, and the methodology for calculating spilled barrels was standardized. For the period of 2019-2022, the average number of hydrocarbon spills greater than 1 barrel with an environmental impact due to operating reasons amounted to 122.25 barrels, which represents a 57% reduction compared to the average for the 2018-2021 period (283.68 Bbls).