IV.2. Environment
(GRI 2-23) (SFC VII)
Commitments and Policies
The Ecopetrol Group is committed to maintaining an accountable business conduct, as reflected in its 2040 Strategy, by means of its business policies, principles, and long-term commitments.
Cultural principle “Life First” under the Declaration of Culture, guides the Ecopetrol Group and its work team in their HSE actions, by establishing the commitment to preserve life in its different manifestations, as evinced in these behaviors:
We take care of ourselves and take care of others.
We act with rigor and discipline in light of the HSE management system.
We protect the environment and our surroundings with future generations in mind.
Ecopetrol applies the principle of precaution under the principle of due diligence and as part of its environmental management efforts; that is, in the absence of knowledge of a potential impact or risk, the Company takes measures to study and technically understand the potential impact or risk during the planning stages of the projects, before they occur, and adopts preventive or mitigation actions that have proven to be effective over time, which are observed and evaluated within the framework of continuous improvement defined in the HSE Management System.
(SASB EM-EP-160a.1) (SFC XVII)
Environmental Strategy
Ecopetrol’s environmental strategy23, approved by the HSE Vice Presidency, establishes the guidelines for Ecopetrol’s environmental management, including the vision, principles, and objectives, as well as the identification of strategic environmental pillars and levers.
It is articulated with the 2040 Strategy: Energy that Transforms, and it unfolds within the framework of the HSE Management System, in accordance with the guidelines set forth in the ISO 14001 standard.

The main specific objectives of the strategy are as follows:
Environmental legal compliance.
Systematic identification and management of potential environmental impacts and risks associated with Ecopetrol’s activities, with a focus on continuous improvement and implementation of the mitigation hierarchy.
Continuous improvement through the definition of strategic pillars and levers.
Foster the environmental culture in employees, contractors, and the Ecopetrol Group.
Generate long-term environmental value around our operations.
Facilitate compliance with corporate environmental goals on the path towards the energy transition.
The environmental strategy is aligned with Ecopetrol’s Risk Management System (SRI), in order to prevent the materialization of potential risks that can impact natural resources and the biota and be prepared to respond to potential emergencies that may pose risks on the environment. It is applicable to all Ecopetrol projects and activities and may, in turn, be adopted by the companies of the Ecopetrol Business Group.
The Environmental Strategy is based on the following basic principles:
Environmental protection is a corporate responsibility that is fostered through its business culture.
Environmental legal compliance is the foundation of environmental management.
The mitigation hierarchy as the cornerstone for the environmental planning of projects and operations.
Continuous improvement as a path to excellence in environmental performance.
The environmentally intelligent challenge for the fulfillment of corporate goals.
The path to net positive environmental impact.
La estrategia ambiental definió ocho (8) pilares estratégicos:
1
Environmental planning and compliance
Prior awareness and diagnosis of environmental aspects and determinants, as well as the specific regulations of the areas where Ecopetrol S.A. undertakes its projects and operations, allow the identification of potential environmental impacts and essential opportunities for the conception and planning of measures focused mainly on the implementation of the mitigation hierarchy, thereby contributing to the successful advancement of operations, the viability of new projects, and sustainable development in the territories where the Company operates.
Ecopetrol, in managing and obtaining environmental authorizations, applies national regulations associated with citizen participation in the territories where it intends to carry out its operations and projects, in order to report on the scope of activities and the environmental and social impacts that may arise, as well as the joint construction of environmental management measures with the different social stakeholders in the area of influence of the projects and operations.
Similarly, during execution, the Company establishes permanent communication mechanisms with the authorities, communities, associations, and other stakeholders, in order to learn and respond to concerns associated with the environmental management of its projects and operations. For this, the company has created the Citizen Participation Office to address petitions, complaints, claims, and suggestions, and meet the requirements of the party concerned, in the times established by Colombian law.
It is important to highlight that the Colombian state, through ANLA, as part of the National Environmental System, is responsible for appraising and authorizing projects, works, or activities in the hydrocarbon sector. To fulfill the legal and environmental terms of a project, Ecopetrol files the request for an Environmental License or the modification thereof with the relevant authority. It is a process used for the planning and administration of projects to ensure that human and economic activities adjust to ecological and resource restrictions, thus constituting a key mechanism to promote sustainable development in the Nation”. (ANLA, 2020)24.

The environmental licensing process begins by filing an Environmental Impact Assessment conducted by the party concerned, which includes, among other aspects, the identification of environmental and social impacts with and without the project, which can be classified as indirect, synergistic, and cumulative.
Similarly, the evaluation and assessment must be conducted using methodologies according to the nature of the project by justifying the assessment of each impact, be it negative or positive. Furthermore, the Environmental Impact Assessment proposes environmental management programs that comprise a detailed description of the set of actions, measures, and activities aimed at preventing, mitigating, correcting, and offsetting the environmental and social impacts arising from the development of a project, work, or activity.
In terms of environmental legal compliance based on the sub-element of the HSE Management System, corporate guidelines are available, and the Environmental Legal Compliance Index is also measured annually to monitor compliance with the requirements.
2
Climate action
Ecopetrol reaffirms its commitment to reduce its carbon footprint, thus adding efforts to limit the global temperature increase to below 1.5°C. To this end, the Company deploys actions to maintain its operations low in carbon emissions and resilient to the effects of climate change, by adequately managing climate-related risks and opportunities.

3
Towards water neutrality
Ecopetrol declared its commitment to be water neutral by 2045, which has been defined as the balance between the water required by the Company for its operations and the direct water footprint, considering efforts to reduce it as much as economically and technically possible, and subtracting the compensation of 100% of the remaining water required to operate through compensation projects executed in the water basin where the Company operates. To achieve this, Ecopetrol has committed to a 66% reduction by 2045 in the catchment of fresh water for industrial use compared to the base year (2019), to eliminating 100% of industrial wastewater dumping into bodies of fresh water, and to offsetting 34% of the remaining water consumption through initiatives that contribute to improving availability in the water basins where it operates.

4
Comprehensive Waste Management
Ecopetrol adopts operating and organizational measures to reduce (up to economically and technically feasible levels) the quantity and hazard caused by the waste generated, based on three (3) fundamental aspects:
- a) Reduction at the source or origin.
- b) Recovery of materials through the use of waste by implementing the Multi-R or 9Rs concept of circular economy.
- c) Incorporation of technologies.

5
Biodiversity and ecosystem services
The strategic biodiversity pillar is intended to adequately manage the risks and opportunities associated with biodiversity and ecosystem services, while addressing the expectations of the Stakeholder Groups and maintaining the operating license. This pillar consists of four (4) fundamental areas:
- Mitigation hierarchy: its purpose is to prevent, avoid, and mitigate impacts on biodiversity and offset residual impacts. Ecopetrol does not intend, nor does it plan to conduct exploration, production, or refining activities in areas of high biodiversity value, categories I to IV according to the International Union for Conservation of Nature (IUCN), nor in areas declared World Heritage Sites by UNESCO.
- Nature-based solutions: they are designed to maintain biodiversity and ecosystem services in strategic areas, by identifying synergies between nature, society, and the local economy to respond to challenges such as climate change (Natural Climate Solutions), climate management, water resources, and biodiversity.
- Generation of knowledge: produces current information on biodiversity and ecosystem services to strengthen the decision-making process.
- Biodiversity culture: the purpose is to strengthen the Company, the value of biodiversity, and ecosystem services.

6
Circular economy
It has been defined as a “production and consumption system that promotes the efficient use of materials, water, and energy, considering the recovery capacity of ecosystems, the circular use of material flows through the implementation of technological innovation, partnerships, and collaborations between stakeholders, and the promotion of business models that respond to the foundations of sustainable development” (ENEC. MADS, Mincomercio, 2019). In this sense, the circular economy is adopted as an enabler that contributes to the fulfillment of goals associated with the energy transition, net zero carbon emissions, the reduction of the water footprint, the closing of the materials and waste cycle, and the diversification of new businesses, to ensure the competitiveness and long-term sustainability of the Company, while striving for the conservation of natural resources and the well-being of society.

7
Clean Air for the Environment
The clean air for the environment pillar focuses on monitoring and managing the contribution to reducing criteria pollutant emissions and/or improving air quality, based on specific initiatives to reduce pollutant emissions and the benefits of decarbonization, energy transition, and clean fuels. The main objectives are:
- Reduce criteria pollutant emissions to world-class standards and contribute to the improvement of air quality to protect the health of the environment.
- Adopt a Verified Inventory of Atmospheric Emissions in the assets operated by Ecopetrol.
- Contribute to achieving and sustaining the level of air quality in the areas of influence of the operations at the target levels specified in the WHO’s Air Quality Guide.

8
Prevention and remediation
The prevention and remediation of environmental impacts caused by operational and process safety incidents focuses on prevention, by incorporating proactive risk management and analyzing the potential materialization of environmental risks inherent to the different businesses of the Company, for which the five (5) lines of work below have been proposed:
- Proactive risk management.
- Incorporation of technology in the management of environmental information.
- Analysis for continuous improvement.
- Remediation and improvement of the condition.
- Impact on culture.

Ecopetrol aligns the pillars of the environmental strategy with applicable national and international commitments, such as the Paris Agreement, the Sustainable Development Goals, national policies, and the National Development Plan, among others, in order to leverage environmental goals and contribute to sustainable development in the country.
Similarly, the environmental strategy and the associated commitments are communicated to all Stakeholder Groups on a permanent basis and in accordance with their needs and expectations. In this regard, the Company publishes its strategy and commitments on its website and via external and internal communication, as well as the engagement plan with partners and environmental authorities, and other pertinent mechanisms.
For more information on the environmental strategy, visit the Ecopetrol website, under the TESG/Environmental section, or click here.
Environmental Investments and Expenses
In 2022, Ecopetrol invested roughly 1,404,485 TRILLION COP in environmental management. This information is presented in Figure 37 and it is reported to the Comptroller General of the Republic in the first quarter of each year.
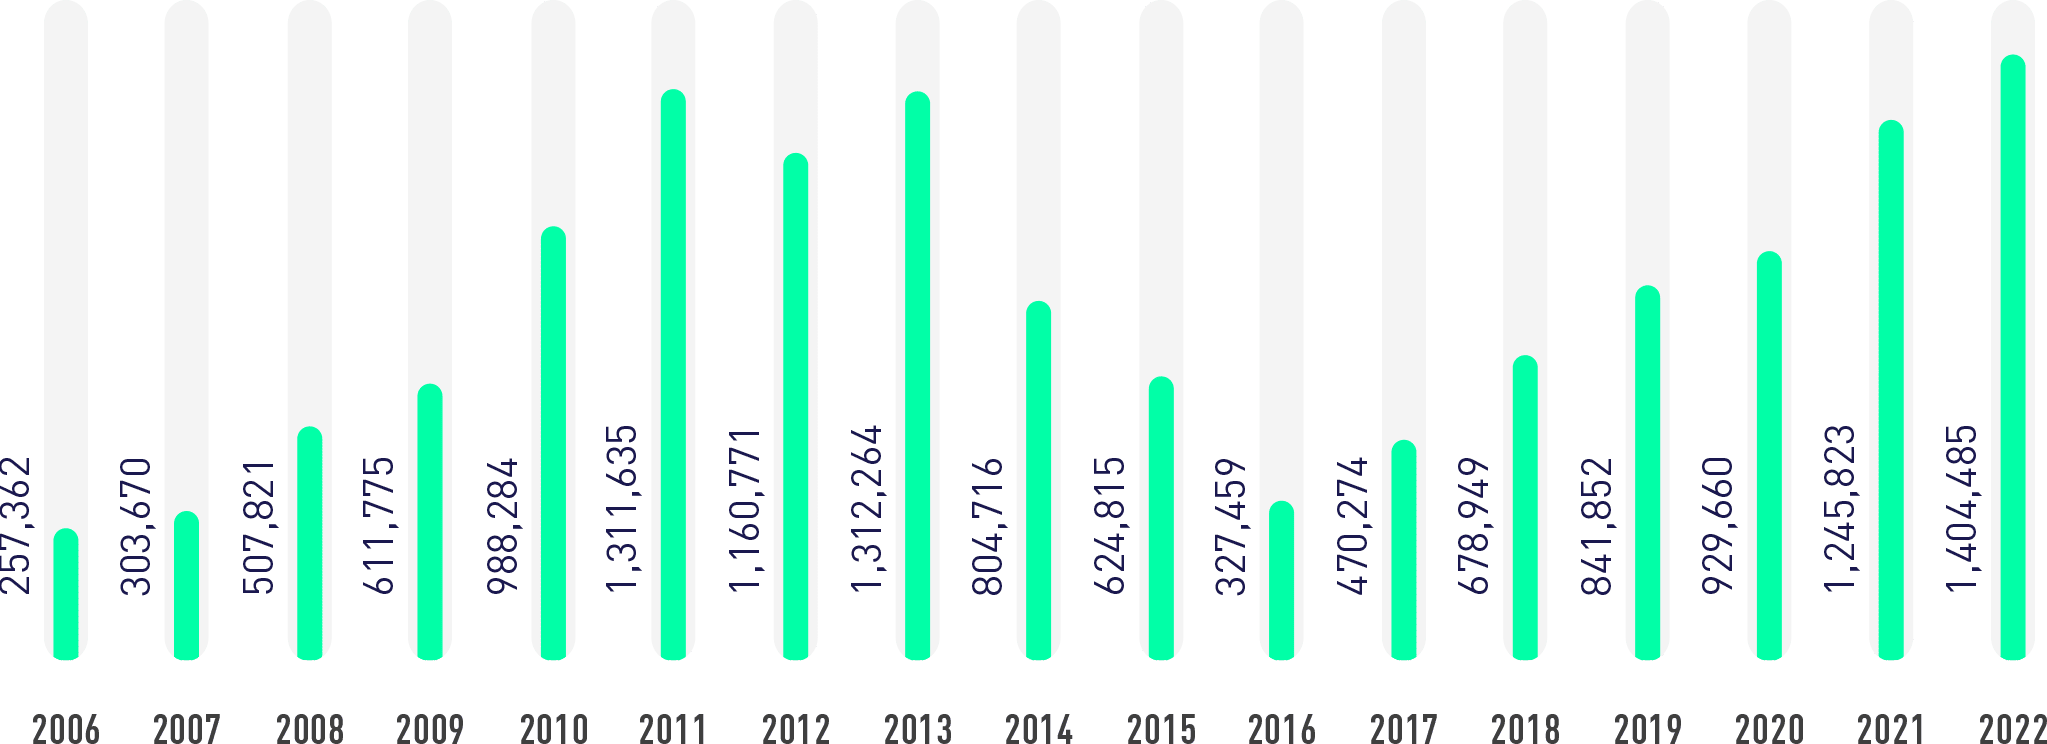
This figure shows an 11% increase compared to 2021, mainly due to: operating investments due to administrative issues, water resource management, investment in forests, and projects associated with biodiversity.
The environmental management investment made in 2022 was distributed as follows:
1
182,617 BCOP allocated mostly to environmental activities such as environmental education,
dissemination of environmental activities, hiring of personnel for environmental management, preparation of environmental studies, and legal procedures, as well as the operation and maintenance of environmental monitoring equipment and networks.
2
67,773 BCOP allocated to the management of natural water resources, conveyed in water recovery and protection programs, the purchase and assembly of equipment to control and monitor the quantity and quality of surface and/or underground water resources, and the protection of water basins.
3
52,024 BCOP were intended for the recovery and protection of forests, including mandatory investments such as environmental compensation.
4
276,904 BCOP for air recovery and protection, with the acquisition of equipment and development of productive technologies to reduce atmospheric emissions.
5
200,225 BCOP for soil recovery and protection, represented in soil protection management and related physical works (geotechnical protection measures).
6
22,728 BCOP in biodiversity, represented in preservation and conservation projects, incorporating flora and fauna components. Some of the most significant projects include the Ecoreserves, participatory monitoring (biomonitors), and related genetic studies.
7
427.106 BCOP in drinking water and basic sanitation, conveyed in wastewater treatment projects, the construction and implementation of drinking water supply works, and the management and disposal
of solid waste and hazardous waste.
8
175.108 BCOP in risk management, represented in activities for the prevention of operational incidents that affect the environment and support in the development of environmental recovery plans and post-disaster activities.

Environmental Planning and Compliance
In terms of environmental planning, the guidelines for environmental viability diagnosis were updated in 2022 to incorporate the assessment of the impacts associated with strategic pillars in the early stages of the projects, based on the mitigation hierarchy, and incorporating early measures for the prevention and minimization of potential impacts and environmental risks.
Ecopetrol holds 426 current environmental authorizations issued by national and regional environmental authorities, distributed as follows:
| Business segment | Environmental Licenses/ Environmental Management Plans/ Environmental Management Measures | Permits for the use and exploitation of natural resources | Lifting of bans |
|---|---|---|---|
| Upstream (Exploration and Production) | 172 | 228 | 6 |
| Refining | 2 | 14 | 0 |
| Others | 0 | 4 | 0 |
3,902 administrative acts issued by environmental authorities were notified to Ecopetrol in 2022, of which 1,657 contained requirements that are subject to systematic monitoring at the strategic, tactical, and operating level, to ensure compliance in time, manner, and place of the obligations set forth by said authorities.
195 procedures were managed and filed with ANLA and the Regional Autonomous Corporations (CAR) in 2022, and the following environmental authorizations were obtained:
National Authority for Environmental Licenses (ANLA)
One (1) environmental license for PPII Kalé – YNC.
One (1) modification to the environmental license issued by Resolution 373 of 1998 for the Medina Occidental exploratory drilling area.
One (1) modification to the environmental license issued by Resolution 0886 of 1998 for the project in the area of the Cusiana TA development wells.
One (1) modification to the environmental license issued by Resolution 0617 of 1994 for the project in the area of the Cusiana R and V development wells.
One (1) modification to the environmental license issued by Resolution 944 of 1999, modified by Resolution 1224 of 2015 for the project in the Yaguará production field.
One (1) modification to the comprehensive environmental management plan – PMAI for Mares (Centro, Lisama, and Llanito Blocks).
One (1) modification to the comprehensive environmental management plan – PMAI for the Apiay Block.
44 environmental authorizations obtained through the legal channel referred to as minor changes with pronouncements.
Regional Autonomous Corporations (CAR)
68 environmental authorizations were obtained from the Regional Autonomous Corporations for the use and exploitation of natural resources in Ecopetrol fields.
In terms of environmental legal compliance, the guidelines for the Management of Environmental Legal Compliance Information were updated in 2022.
The annual Environmental Legal Compliance Index, to monitor compliance with the requirements, stood at 99.9%, the highest registered in Ecopetrol.
Compensation for the Use of Natural Resources
and Forced Investment of No Less Than 1%
The environmental obligations deriving from the use and exploitation of natural resources and the catchment of water from water basins are executed in accordance with the 1% investment plans and the compensation plans for the use and exploitation of natural resources approved by the environmental authority and incorporated into control and monitoring instruments (environmental licenses, management plans, and environmental permits).
As of December 31, 2022, Ecopetrol was executing 105 1% investment plans and 115 environmental compensation plans that will contribute to the conservation of biodiversity in 13,000 hectares.
The main mechanisms for complying with these obligations are:
The signing of voluntary conservation agreements with incentives in kind through the participation of local communities.
The acquisition of properties for protection, conservation,
and preservation purposes.
Actions for ecological restoration and the rehabilitation
and recovery of ecosystems.
Some of the main achievements attained in compliance with these obligations are:
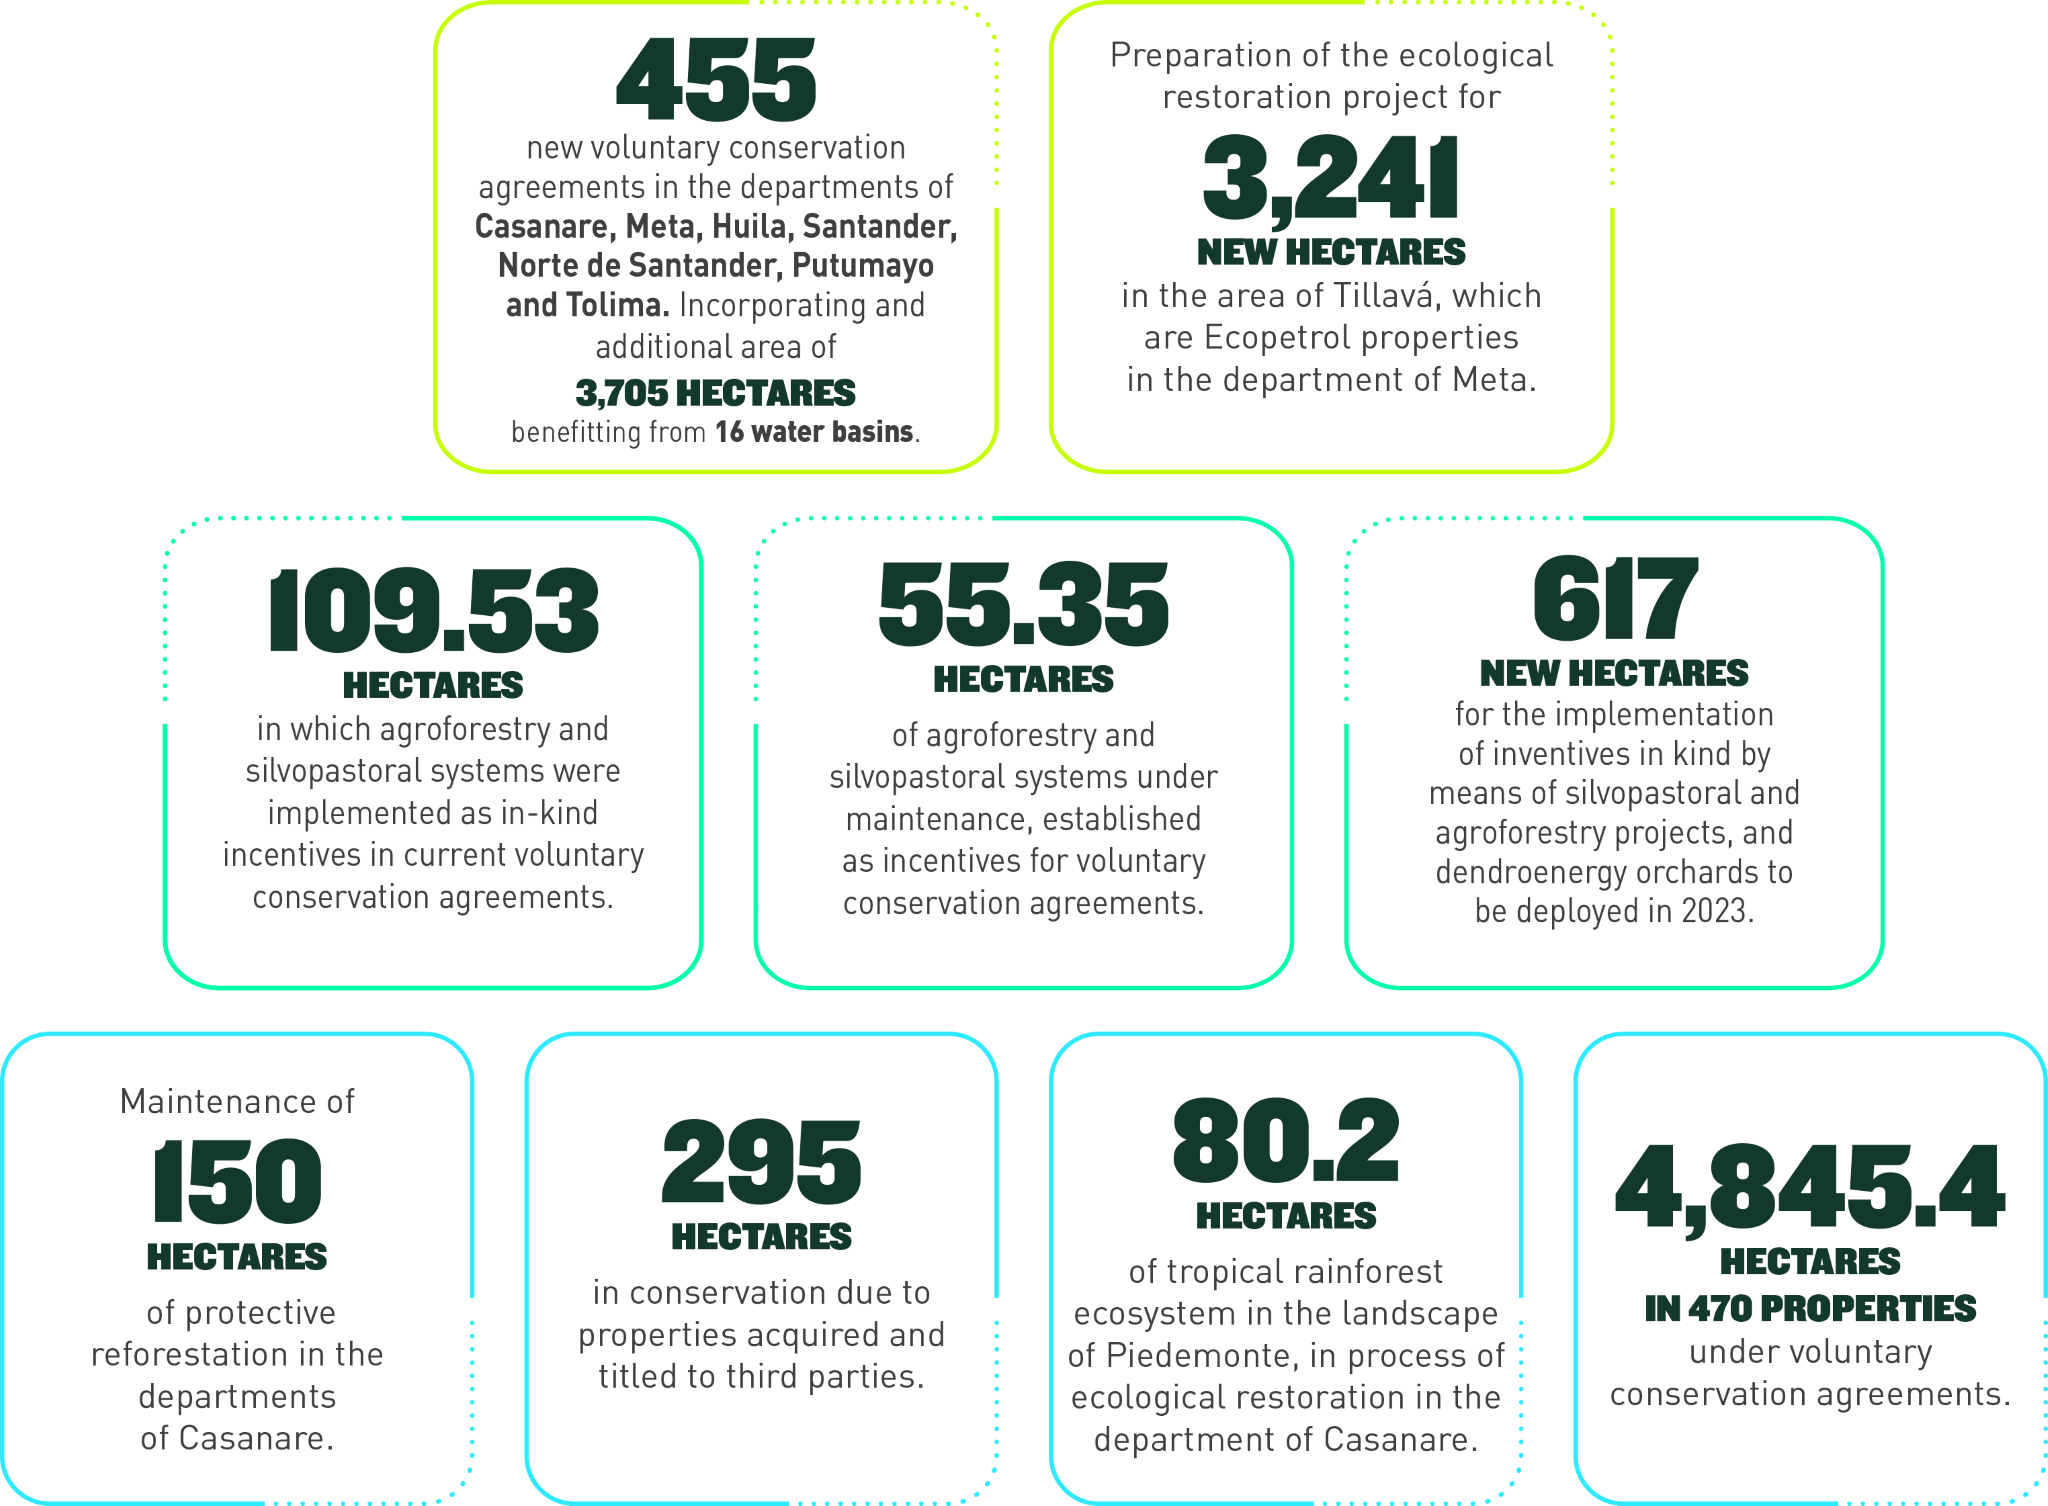
- Signing of 455 new voluntary conservation agreements in the departments of Casanare, Meta, Huila, Santander, Norte de Santander, Putumayo, and Tolima, incorporating an additional conservation area of 3,705.17 hectares benefiting from 16 water basins.
- 295 hectares under conservation through properties acquired and titled in the name of regional authorities for conservation purposes.
- Agroforestry and silvopastoral systems were implemented in 109.53 hectares as an incentive in kind under the current voluntary conservation agreements.
- 617 new hectares for the implementation of incentives in kind, including silvopastoral and agroforestry projects and dendroenergy orchards to be deployed in 2023.
- 80.2 hectares of tropical humid ecosystems in the heart of Piedemonte undergoing ecological restoration in the department of Casanare.
- Conservation measures implemented in the 4,845.4 hectares part of the 470 properties under voluntary conservation agreements.
- Appraisal of the ecological restoration project of 3,421 new hectares in the heart of Tillavá, which are properties owned by Ecopetrol in the department of Meta.
- Maintenance of 150 hectares of protective reforestation in the department of Casanare.
- Maintenance of 55.35 hectares of agroforestry and silvopastoral systems and dendroenergy orchards established as incentives in the voluntary conservation agreements.
In 2022, a total of 9,747 hectares were covered with the activities of the environmental compensation plans and the forced investment of no less than 1%, by deploying conservation actions that include preservation, restoration, and sustainable use efforts.
The achievements in biodiversity and ecosystem services with the implementation of compensation plans for the biotic environment and the forced investment of no less than 1% in 2022 are shown in Figure 38 below:
Roadmap
Climate Change
Exceptional
Material Element
(GRI 3-3, 11-1-1) (WEF 7, 7E, 11E, 13E) (SFC XV)
| Impacted stakeholder groups | Areas that manage the impacts | Ecopetrol business line or segments generating the highest impact |
|---|---|---|
| Suppliers | VCU | Upstream |
| Associates and Partners | VAB | Midstream |
| Customers | VNE | Downstream |
| Employees | VCF | Commercial |
| Investors | VHSE | Low emission solutions |
| State | VPU | |
| Society and Community | VRP | |
| VSE |
Why is the Element Material?
GHG emissions, including methane, and their effect on global temperature rises, are considered a negative impact due to the changes generated in long-term climate conditions, evinced in the occurrence of extreme weather events ( floods and droughts) that mainly affect the most vulnerable populations, as well as the right to a healthy environment, personal safety, water, and development, among others. Given the above, Ecopetrol defined climate change as an exceptional material element, establishing a roadmap with short, medium, and long-term actions to manage its impacts.
The identification of low emission solutions and the consolidation of mitigation programs in the direct operations of the Company alleviates the effects of climate change and generates positive economic impacts, process efficiencies, and GHG emission reductions.
In the same way, the consolidation and development of Natural Climate Solution projects (avoid deforestation, restoration, reforestation, and rehabilitation) generate a positive impact on strategic ecosystems with tangible benefits for the communities, and also enable the options for the compensation of GHG emissions.
The operations undertaken by the Company in the production, transport, refining, and trading of hydrocarbons and their derivatives have an impact on climate change due to GHG emissions that may alter future climate conditions and cause changes in the climate dynamics of the territories.
Ecopetrol advances in the analysis of climate scenarios based on science, to dive into the identification of physical and transition risks, as well as financial and strategic impacts on the management of the Company.
Policies
and Commitments
In developing the 2040 Strategy and the Environmental Strategy, the Ecopetrol Group announced its plan towards net zero carbon emissions by 2050 (Scopes 1 and 2). This plan includes the goal of reducing 50% of its Scope 1, 2, and 3 emissions by 2050, and 25% of its Scope 1 and 2 emissions by 2030, compared to 2019. This commitment includes compliance with other international agreements, such as the methane reduction initiative of the Climate and Clean Air Coalition (CCAC) led by the United Nations and the “Zero Routine Flaring by 2030” initiative led by the World Bank. Additionally, the Company has an annual emission reduction goal in pursuit of advancing the Company’s compliance levels in the medium and long term.
The GHG emissions target for 2022 was 262,761 tCO2eq, which was exceeded by 59% with 416,672 tCO2eq.
(GRI 3-3-d) (SASB EM-EP-110a.3) (SFC XV, XVII) (TCFD M-1.2.1)
How is the Material
Element Managed?
In developing the environmental strategy, Ecopetrol has adopted a strategic pillar known as Climate Action, which seeks to maintain a low carbon emission operation, decrease the vulnerability of the infrastructure and the operations to climate variability and change, as well as adequately manage risks and identify opportunities associated with climate change. This strategic pillar includes five main areas:

To achieve the goals and contribute to the mitigation of climate change impacts, the Company has defined the decarbonization plan focused on the following measures:
Permanent updating and continuous verification of the GHG inventory by a third party every two (2) years.
Identification, development, and implementation of operating initiatives associated with energy efficiency, renewable energy, reduced flaring and fugitive emissions, and venting (methane).
Development of emerging technologies such as green hydrogen (H2) and CCUS.
Implementation and consolidation of a compensation portfolio through Natural Climate Solutions, to offset residual emissions that cannot be avoided or reduced in the operation and which can, in turn, generate social and environmental benefits.
Diversification towards low emission businesses and optimization of the current portfolio by means of economic instruments such as the internal carbon price.
How is the material
element evaluated?
It is evaluated by monitoring the advancement and compliance with the actions established in the TESG roadmap for the climate change element and the management indicators of the Company’s Balanced Management Board (TBG), which includes the GHG emissions reduction indicator.
Progress is also measured in specific programs:
- (i) Energy efficiency.
- (ii) Renewable energy.
- (iii) Reduction of flaring and fugitive emissions.
- (iv) Natural Climate Solutions projects, among others.
With regard to the climate-related physical and transition risks that may affect the operation, the facilities, and the environment, the Company monitors the treatment actions, controls, and KRIs through the “Inadequate climate change and water management” business risk.
Short, Medium, and Long
Term Goals and Projects
Short Term (2023-2024)
Update and verify the GHG inventory every two
(2) years.
Reduce 1.6 tCO2e (2020-2024).
Implement operating reduction projects.
Produce roughly 900 MW of renewable energy for
self-generation by 2025.
Develop Natural Climate Solution -SNC projects.
Medium Term (2025-2030)
Reduce 25% of GHG emissions by 2030 (Scopes 1 and 2).
Zero Routine Flaring by 2030.
Produce 50,000 t of green hydrogen by 2030.
Increase energy efficiency +6% by 2030.
Incorporate 1,000 MW
of renewable energy by 2030.
Capture between 2-4 MtCO2e through Natural Climate Solutions (SNC) by 2030.
Long Term (>2030)
Net zero emissions by 2050 (Scopes 1 and 2).
Reduce 50% of Scope 1, 2, and 3 emissions by 2050.
Produce 1 Mt of hydrogen by 2040.
Gradually incorporate projects associated with H2 and CCUS.
Consolidate the project portfolio into Natural Climate Solutions to capture between 2-4 MtCO2e per year.
Increase energy efficiency by approximately 10% by 2040.
Main Achievements in the Management
of the Climate Change Roadmap
Reduction of 416,672 tCO2e (2020-2022) in energy efficiency and renewable projects, among others. Accumulated reduction of 910,113 tCO2e (2020-2022).
586,226 tCO2e verified by a third party.
95% of production assets operated with methane detection and measurement. 1,699 leaks fixed out of the 1,690 planned.
Implementation of the internal carbon price as a mandatory variable for economic evaluation to adopt decisions on current and future investments.
Natural Climate Solution projects with Fundación Natura, TNC, WCS, and Conexión Jaguar – ISA, which enable the capture of 1.3 Mt of CO2e.
Subsidiaries Cenit, ODL, ODC, Bicentenario, Ocensa, and Esenttia obtained the Carbon Neutrality certification.
Sale of 4 million barrels of Castilla Blend crude and 300,000 barrels of offset extra-carbon gasoline.
Publication of three (3) decarbonization clauses to promote mitigation actions in the supply chain.
In 2022, the CDP (Disclosure Insight Action) acknowledged Ecopetrol for the results and leadership in the development of its Climate Change program with an A- rating, which positions the Company as an industry, regional, and global benchmark on the subject matter.

Climate Change Management
and Governance
The Board of Directors defines and supervises the strategy defined by Ecopetrol and its Group. They permanently monitor and address issues associated with the TESG pillar under the 2040 Strategy, which includes climate change and the energy transition, among other topics.
The Company’s senior management plays a fundamental role in executing the strategy defined by the Board of Directors, while integrating climate-related metrics and defining the short, medium, and long-term action plan.
- Presidency (CEO):
responsible for steering and managing the Company. He is responsible for the Company’s Balanced Management Board and for reporting on the progress made to the Board of Directors. - Executive Vice Presidency of Operations:
leads the Company’s operations, the execution of the initiatives associated with the Decarbonization Plan, and the implementation of the Net Zero Emissions strategy for the hydrocarbons business, as well as the objective of improving fuel quality. - Vice Presidency of Low Emission Solutions
leads the advancement of the Company’s energy transition, integrating the areas of gas, biogas, liquefied petroleum gas (LPG), energy, renewables, hydrogen, and CCUS. - Vice Presidency of Corporate Strategy and New Businesses:
designs the energy transition strategy, including the generation of low emission opportunities. - HSE Vice Presidency:
guides climate change, the circular economy, and biodiversity efforts through the Sustainability and Decarbonization Management team. Specifically in terms of climate change, it leads the implementation of the Decarbonization Plan, defines emission reduction and compensation goals, manages the Atmospheric Emissions Management System (SIGEA), defines the guidelines for the management of emission compensations, and sets climate change adaptation measures to reduce climate-related vulnerabilities and risks. - Vice-Presidency of Corporate Affairs and Secretary General:
ensures the governance of the different reporting instruments (including RIGS, DJSI, and CDP Climate Change and Water, among others), the monitoring and analysis of the “Generating Value with TESG” pillar, and the roadmaps of the material elements. - Corporate Vice Presidency of Compliance:
responsible for the SRI and the management of business risks, including those associated with climate change and the energy transition. - Corporate Vice Presidency of Finance:
leads the implementation and analysis of the internal carbon price, and responsible for portfolio management and capital allocation. Evaluates and analyzes the financial impact of climate-related risks and opportunities and sustainable financing alternatives. Similarly, it leads the engagements with investors such as Climate Action 100+ and Net Zero Asset Managers Initiative, risk rating agencies and environmental, social, and governance radars-ESG (e.g.: MSCI, Sustainalytics, and others). It is responsible for the coordination and publication of the TCFD and SASB reports. - Upstream Vice Presidency:
leads the implementation of decarbonization projects and climate change adaptation measures for exploration and production operations. - Marketing Vice Presidency:
participates in the process of estimating GHG emissions from hydrocarbon operations until they are marketed, and manages the acquisition of carbon credits to supply the internal demand of the Ecopetrol Group and to offset the emissions associated with some products marketed by the Company. - Vice Presidency of Refining and Industrial Processes:
responsible for the identification, evaluation, and implementation of initiatives aligned with the Company’s energy transition, decarbonization, and integrated water management strategy. - Vice Presidency of Science, Technology, and Innovation:
leads the technological and digital transformation to leverage the TESG pillar under the 2040 Strategy, as well as the decarbonization and energy transition process.
(GRI 11-2-2) (TCFD -1.2, E-1.3, GR-1.2) (SFC XV)
Climate-related risks
In 2022, Ecopetrol advanced in the process of identifying and evaluating physical and transition climate risks, considering short, medium, and long-term climate scenarios.
Physical and transition risks are often seen as opposites. The greatest transition risks are associated with the most aggressive reduction policies, such as the goal of net zero emissions, while physical risks are greater in lax policy scenarios, in which emission increases are expected to cause more extreme weather events. Accordingly, the IEA, the IPCC, and the SSP have set in motion multiple future climate scenarios that capture a series of policy decisions and climate outcomes.
Ecopetrol identified and analyzed seven (7) physical risks related to chronic threats (drought and thermal stress) and acute threats (precipitation, coastal flooding, river flooding, fires, and winds) in 95 sites associated with the Group’s most important assets. The modeling was conducted using Cervest’s EarthScan platform with the following IPCC scenarios:
- (i) Scenario aligned with the objective of the Paris Agreement (SSP1- RCP2.6).
- (ii) Peak emissions scenario in 2040 (SSP2- RCP4.5).
- (iii) Business as usual scenario (SSP5- RCP8.5).
EarthScan uses regional climate models with diverse data sets to analyze the physical vulnerability of assets, relative to the potential impact of climate hazards. The probability and severity of climate events are estimated up to 2100.
In terms of transition risks, six (6) market, technology, reputation, and regulation-related risks were identified. Market and regulatory risks were prioritized for the modeling, using the following analysis avenues:
- (i) Quantification of the impact on income arising from a changing demand for hydrocarbons.
- (ii) Quantification of the impact on costs due to changes in carbon prices.
- (iii) quantification of the financial repercussions deriving from higher abatement costs due to limitations on the use of compensations.
The model used the scenarios in the 2022 WEO of the International Energy Agency:
- (i) Net Zero Emissions (NZE).
- (ii) Announced Pledges Scenario (APS).
- (iii) Stated Policies Scenario (STEPS).
(GRI 11-2-2) (SFC XV) (TCFD E-1.3)
Impact of Climate-related Risks
on the Organization’s Business,
Strategy, and Financial Planning
The physical risks arising from climate change can cause (acute) events, which are related to climate variability phenomena such as the “El Niño” or “La Niña”, in the case of Ecopetrol, or long-term (chronic) changes in weather patterns. Physical risks may entail financial repercussions for the Company, such as direct damage to assets or indirect impacts caused by interruptions in the production chain.
In 2022, Ecopetrol conducted the assessment of physical risks in its assets in Colombia to understand the Company’s vulnerability to future climate scenarios. The results showed that the increase in maximum temperatures and the duration of heat waves pose the greatest threats to the entire asset portfolio. This is one of the most important risks in terms of worker safety and even operating interruptions. However, it is not expected to have a direct impact on the infrastructure. Moreover, six (6) locations are at substantially higher risk of coastal flooding (including the Cartagena refinery), and more moderate river flooding is anticipated at four locations (including the Barrancabermeja refinery).
The rest of climate threats are not expected to increase substantially across the portfolio.
To mitigate potential impacts and guarantee the continuity of activities in the event of prolonged weather events, Ecopetrol has implemented regional climate variability adaptation plans, which incorporate measures for water resource management, climate resilient infrastructure, restoration and conservation of strategic ecosystems, and climate compatible operations.
With regard to the impact on financial planning, based on the assessment of the physical risks, Ecopetrol will advance in the estimation of potential losses in the assets with the highest probability of being impacted by the materialization of risks. Based on the analysis of financial implications, the Company will define actions to reduce the impact on its business strategy.
The transition to a low carbon economy may entail political, legal, technological, and market changes to address mitigation and adaptation requirements related to climate change. Depending on the nature, speed, and focus of these changes, transition risks can exert different levels of financial and reputational impacts on the organizations.

Ecopetrol has implemented regional climate variability adaptation plans, which incorporate measures for water resource management, climate resilient infrastructure, among others.
(GRI 201-2, 11-2-2) (TCFD GR-1.1) (SFC XV)
The evaluation conducted by Ecopetrol in 2022 included stress tests on the long-term strategy of the upstream asset portfolio. The portfolio’s resilience was evaluated by comparing the VPN of future cash flows from IEA scenarios with the VPN of Ecopetrol’s base case. In both cases, the hypotheses associated with the analysis avenues were applied. However, this first analysis will be subject to review and assessment to determine the potential impact on the Company’s financial and strategic planning.
The process of identification and evaluation of climate-related risks (physical and transition) is conducted in line with Ecopetrol’s risk management framework, TCFD guidelines, and best practices in the sector. The process broadly considers the following elements, which must be discerned separately into physical and transition risks:
Plan:
defining the context in which the external climate-related physical, regulatory, market, technological, and reputational risks that could materially impact the business are monitored. The methodology and parameters for modeling are also established.
Identify:
based on the analysis of the internal and external context, threats and opportunities, uncertainties, sources of risk, vulnerabilities, and capacities, with the purpose of defining the risks that can positively or negatively divert the Company’s achievement of its strategic objectives.
Measure and evaluate:
risk assessment based on the defined parameters, hypotheses, and data to measure the impact on the company. The appetite, or level of risk that the company is willing to accept without taking measures must be defined, which will set an important precedent to assess the risk and to make decisions on the approach to be adopted. Risk assessment helps sustain the decisions adopted for future actions in each company, as well as the processes, activities, businesses, and others, and the prioritization thereof to guarantee that the available resources are used to address the most critical aspects.
Respond:
the company must evaluate the results of the risk assessment and determine specific action plans to mitigate or adapt to those that exceed a specific threshold for action. Response plans can be proactive (e.g. divestment or investment in an asset, engineering controls) or reactive (e.g. reinforcing emergency response plans, improving employee communication mechanisms), while action plans must assign responsible parties and be integrated into the company’s annual risk management process.
Monitor and review:
according to the review cycles determined by risk management and the strategy, the parties responsible for the action plans must evaluate whether the interventions and actions have given the expected results, or if they need to be adjusted or modified. The team must review whether the initial hypotheses and the data used are still valid or need to be reassessed. The company must also monitor risk exposure and compare actual and projected impacts to validate and improve the modeling.
Report:
the company must document the results of the risk assessment, the measures adopted, the hypotheses, and the impact, to include them in the reports submitted to the parties interested in risk management, which must back the duties and responsibilities of senior management in this regard, as well as those of the Committees and the Board of Directors.

The foregoing must be based on Ecopetrol’s Comprehensive Risk Management System, in alignment with ISO 31000 and COSO ERM 2017.
To manage climate-related risks, Ecopetrol incorporated “Inadequate climate change and water management” into the business risk map, which includes nine (9) mitigation measures, five (5) KRIs, and 10 controls associated with the process. This is reviewed annually within the framework of the risk management cycle. The appraisal scenarios and mitigation measures will be updated in 2023 based on the analysis of physical and transition risks.
Monitoring the Effectiveness of the Measures Adopted
The effectiveness of the actions and measures adopted to mitigate GHG emissions is monitored using the “Decarbonize operations: GHG reduction KRI” indicator, which is monitored monthly and reported quarterly. This indicator is part of the Ecopetrol Group’s Balanced Management Board (TBG) and Long-Term Incentive Plans (ILP), directly monitored by the Board of Directors.
Similarly, there is a business risk called “Inadequate Climate Change and Water Management,” which monitors compliance with emission reduction goals, as well as other specific climate change actions and controls such as the evaluation of internal carbon price guidelines, cost-effective technologies for water management and decarbonization, the probability of occurrence of extreme weather events, the monitoring of climate change regulations, among others.
Lessons Learned and Incorporation into
the Company’s Operating Policies and Procedures
The reduction of GHG emissions, as the main measure to mitigate the effects of climate change, is incorporated at various levels of the Company. In terms of the “Energy that Transforms” long-term business strategy, it is linked to the areas of “Growing with the energy transition” through the diversification of energy and low emission businesses, and “Generating value with TESG” through the acceleration and prioritization of decarbonization and energy efficiency, and the Risk Management System through the “Inadequate climate change and water management” business risk, against which operating actions have been implemented to minimize the materialization thereof. Similarly, the Company is conducting a more detailed analysis of physical and transition risks based on climate scenarios, in order to identify new opportunities and measures to mitigate strategic and financial climate-related impacts that can be incorporated into its financial and risk procedures.
How are Stakeholders Involved in
Taking Action to Manage Climate Change?
Climate change management involves different Stakeholder Groups:
Suppliers:
adoption of decarbonization commitments related to:
(i) the estimation of GHG emissions, (ii) the deployment of specific measures to mitigate and/or offset their GHG emissions, and (iii) the definition of specific short, medium, and long term emission mitigation or compensation goals.
Customers:
purchase of carbon-offset crude oil and premium gasoline shipments, with Colombian carbon projects, in Natural Climate Solutions, which benefit communities and have positive impacts on the environment.

National state:
establishment of emission reduction goals and national programs that contribute to defining the Company’s climate ambition.

Shareholders and investors:
constant interactions with this Stakeholder Group to address requirements and requests in this regard, in pursuit of demonstrating the adoption of real commitments for the management of GHG emissions and a fair and gradual energy transition that positively impacts their investments.

Associates and partners:
articulation and integration of measures related to climate change management.
(GRI 305-1, 11-1-5, 11-1-6, 11-1-7) (WEF) (TCFD)
Metrics
The GHG emissions target for 2022 was 262,761 tCO2eq, which was exceeded by 59%, with 416,672 tCO2eq.
| Emissions | Unit of measurement | 2019 | 2020 | 2021 | 2022 |
|---|---|---|---|---|---|
| Gross value of direct GHG emissions (Scope 1) | TonCO2e | 14,448,557 | 13,418,819 | 13,436,094 | 13,309,595 |
| Gross value of indirect GHG emissions when generating energy (Scope 2) | TonCO2e | 636,803 | 859,944 | 574,750 | 416,501 |
| Gross value of other indirect GHG emissions (Scope 3) | TonCO2e | 144,502,609 | 139,526,904 | 137,264,619 | 150,528,333 |
Nota 1. Para este cálculo los gases incluidos son: CO2, CH4 y N2O.
Note 2. Ecopetrol’s atmospheric emissions inventory for Scopes 1 and 2 is structured under the operational control approach. As recommended by ISO 14064 -1 and the GHG Protocol, base year emissions must be recalculated each time a company experiences major changes such as acquisitions, divestitures, and mergers, as well as significant changes in the emissions estimation methodology. This is recalculated not only for the base year but also for the historical series in order to maintain consistency in the reported data. In accordance with the foregoing, the emissions in the base year (2019) and in the historical series have been recalculated considering the following:
* Bottom-up and top-down methane measurements taken in the production segment, as part of the Company’s plan to improve the detection, quantification, and closure of fugitive and vented emissions, covering 95% of the Company’s facilities; adjustment and construction of own emission factors, and changes in the emission estimation methodology. These adjustments represent increased emissions in the order of 2.4 million tons of CO2e/year.
* The reversal of the Nare asset in the production segment, which increases by approximately 0.9Mt of CO2e.
* The update of the inventory in accordance with the NTC ISO 14064 – 2020 version, including transportation emissions in Scope 1 (these emissions were being reported in Scope 3).
Note 3. The 2022 report shows a significant reduction in Scope 2 emissions (28%), mainly due to changes in the sources of electricity generation, which are less CO2 intensive. The emissions data for Scope 3 is structured under the operational control approach (same as Scope 1 and 2). The emissions associated with Ecopetrol S.A. and the Cartagena Refinery are estimated accordingly. Emissions increased in 2022, mainly due to rises in: i) national fuel sales (gasoline, diesel, and gas), ii) national crude oil purchases (for loading in refineries), and iii) refined product imports (especially gasoline).
Note 4. i) Data adjusted based on the update of the 2019, 2020, and 2021 SIGEA ii) The data for 2022 corresponds to information inventoried for the first 10 months of the year, and averaged for the months of November and December. This data may change once the final information is available.
(GRI 305-1, 305-2, 305-3, 11-1-5, 11-1-6, 11-1-7) (WEF 7,7E) (TCFD M1.2.1)
| Emissions | Unit of measurement | 2019 | 2020 | 2021 | 2022 |
|---|---|---|---|---|---|
| Scope 1 biogenic CO2 emissions | TonCO2e | 1,254 | 1,222 | 1,115 | 1,005 |
| Scope 2 biogenic CO2 emissions | TonCO2e | 0 | 0 | 0 | 0 |
| Scope 3 biogenic CO2 emissions | TonCO2e | 265,184 | 224,087 | 276,338 | 297,901 |
*Biogenic GHG emissions are the emissions from the combustion of biomass or derivative fuels (e.g., biodiesel and fuel alcohol), which are considered neutral, since they are generated in the natural carbon cycle.
Note. i) Data adjusted based on the updates of the 2019, 2020, and 2021 SIGEA ii) The data for 2022 corresponds to information inventoried for the first 10 months of the year, and averaged for the months of November and December. This data may change once the final information is available.
(GRI 11-1-5, 11-1-6, 11-1-7) (WEF 7, 7E) (SASB EM-EP-110a.1) (TCFD M-1.2.1)
- Compendium of Greenhouse Gas Emissions Estimation Methodologies for the Oil and Gas Industry – API
- FECOC
- UPME
- AP-42
- ARPEL
- CORINAIR
(SASB EM-EP-110a.1) (WEF 7,7E) (TCFD M-1.2.1)
| Emissions | Unit of measurement | 2019 | 2020 | 2021 | 2022 |
|---|---|---|---|---|---|
| Carbon dioxide (CO2) emissions | TonCO2e | 5,931,131 | 5,714,216 | 5,519,952 | 5,342,845 |
| Methane (CH4) emissions | TonCO2e | 2,736,389 | 2,784,829 | 2,737,323 | 2,670,270 |
| Nitrous oxide (N2O) emissions | TonCO2e | 22,455 | 23,207 | 22,468 | 21,167 |
| Hydrofluorocarbon (HFCs) emissions | TonCO2e | NA | NA | NA | NA |
| Perfluorocarbon (PFCs) emissions | TonCO2e | NA | NA | NA | NA |
| Sulfur hexafluoride (SF6) emissions | TonCO2e | NA | NA | NA | NA |
| Nitrogen trifluoride (NF3) emissions | TonCO2e | NA | NA | NA | NA |
| Scope 1 gross global emissions | TonCO2e | 8,689,974 | 8,522,251 | 8,279,742 | 8,034,282 |
| Percentage of methane (CH4) | % | 31.5 | 32.7 | 33.1 | 33.236 |
Note 1. The consolidated emissions from the exploration and production segment of the hydrocarbon business line are reported.
Note 2. The option of Not Applicable is given to Hydrofluorocarbon Emissions (HFCs), Perfluorocarbon Emissions (PFCs), Sulfur Hexafluoride Emissions (SF6), and Nitrogen Trifluoride Emissions (NF3), which are not part of Ecopetrol’s emissions inventory.
Note 3. The disaggregated emissions of each of the pollutants measured in the inventory are reported in the Exploration and Production segment for Scope 1. The sum of the three (3) GHGs reported (CO2, CH4, and N2O) is equivalent to Scope 1 emissions for this segment.
(SASB EM-EP-110a.1) (WEF 7,7E) (TCFD M-1.2.1)
| Emissions | Unit of measurement | 2019 | 2020 | 2021 | 2022 |
|---|---|---|---|---|---|
| Carbon dioxide (CO2) emissions | GWP | 1 | 1 | 1 | 1 |
| Methane (CH4) emissions | GWP | 28 | 28 | 28 | 28 |
| Nitrous oxide (N2O) emissions | GWP | 265 | 265 | 265 | 265 |
| Hydrofluorocarbon (HFCs) emissions | GWP | NA | NA | NA | NA |
| Perfluorocarbon (PFCs) emissions | GWP | NA | NA | NA | NA |
| Sulfur hexafluoride (SF6) emissions | GWP | NA | NA | NA | NA |
Note 1. The consolidated emissions from the exploration and production segment of the hydrocarbons business line are reported.
Note 2. The option of Not Applicable is given to Hydrofluorocarbon Emissions (HFCs), Perfluorocarbon Emissions (PFCs), Sulfur Hexafluoride Emissions (SF6), and Nitrogen Trifluoride Emissions (NF3), which are not part of Ecopetrol’s emissions inventory.
(SASB EM-EP-110a.1) (WEF 7,7E) (TCFD M – 1.2.1)
Emissions Under
Regulatory Limits
No information associated with this indicator is reported because there is no regulation associated with said emissions (or the methane emitted) in Colombia; therefore, a percentage covered under the regulatory limit of GHG emissions is not applicable.
(SASB EM-EP-110a.1) (WEF 7,7E) (TCFD M-1.2.1)
| Scope 1 gross global emissions | Unit of measurement | 2019 | 2020 | 2021 | 2022 |
|---|---|---|---|---|---|
| Amount of hydrocarbons burned- flaring | TonCO2e | 1,167,505 | 921,565 | 905,422 | 953,120 |
| Amount from other combustions | TonCO2e | 4,705,861 | 4,713,633 | 4,536,010 | 4,274,770 |
| Amount of process emissions | TonCO2e | 2,413,994 | 2,475,349 | 2,439,135 | 2,430,017 |
| Amount of vented emissions | TonCO2e | NA | NA | NA | NA |
| Amount of fugitive emissions from the operation | TonCO2e | 402,613 | 411,704 | 399,165 | 376,375 |
| Amount of Scope 1 gross global emissions | TonCO2e | 8,689,974 | 8,522,251 | 8,279,742 | 8,034,282 |
Note 1. The consolidated emissions from the exploration and production segment of the hydrocarbons business line are reported.
Note 2. The process emissions category includes emissions associated with gas treatment, storage tank venting, and well venting.
(GRI 305-4, 11-1-8) (TCFD M-1.2.1)
GHG Emissions
Intensity
The intensity of the upstream segment is estimated by dividing Scope 1 and 2 emissions generated in the segment into production, which includes crude oil, gas, and white products, expressed in terms of barrels of oil equivalent -BOE-, under the organizational limit set by operating control.
The intensity of the downstream segment is estimated by dividing Scope 1 and 2 emissions generated in this segment into the annual inflows to the Barrancabermeja and Cartagena refineries, expressed in terms of barrels of oil equivalent -BOE-, under the organizational limit set by operating control.
(GRI 305-4, 11-1-8) (TCFD M-1.2.1)
| Process | Unit of measurement | 2019 | 2020 | 2021 | 2022 |
|---|---|---|---|---|---|
| Production | KgCO2e/BOE | 40.39 | 43.51 | 43.36 | 41.46 |
| Refining and petrochemical | KgCO2e/BOE | 41.95 | 41.59 | 39.68 | 40.12 |
Note 1: i) Data adjusted based on the updates of the 2019, 2020, and 2021 SIGEA; ii) The data for 2022 corresponds to information inventoried for the first 10 months of the year, and averaged for the months of November and December. This data may change once the final information is available.
Note 2. The carbon intensity of the production segment underwent significant changes throughout the historical series, mainly associated with the inclusion in the inventory of bottom up and top down methane measurements taken from the different assets of the Company and the reversal of the Nare asset.
Note 3. The gases included in the table are CO2, CH4, and N20.
(GRI 305-5, 11 -2 -3, 11-1-7) (TCFD M-1.2.1) (WEF 7, 7E) (SFC XV, XVI)
Reduction of GHG Emissions
| Emissions | Unit of measurement | 2019 | 2020 | 2021 | 2022 |
|---|---|---|---|---|---|
| Energy efficiency | TonCO2e | 161,473 | 128,596 | 186,713 | 154,976 |
| Fugitive and vented emissions | TonCO2e | 0 | 23,257 | 59,817 | 101,602 |
| Flaring optimization | TonCO2e | 210,370 | 47,994 | 45,135 | 150,852 |
| Renewable energy | TonCO2e | 8,760 | 0 | 1,929 | 9,243 |
Note: i) Data adjusted based on the updates of the 2019, 2020, and 2021 SIGEA; ii) The data for 2022 corresponds to information inventoried for the first 10 months of the year, and averaged for the months of November and December. This data will change once the final information is available.
(GRI 11-2-3) (TCFD M-1.2.1)
| Description of the initiative | Gases included in the calculation | Scopes that presented reductions | Standards or methodologies used for the calculation | Development stage |
|---|---|---|---|---|
| Energy efficiency: Includes projects associated with changes in the energy matrix for another with less impact and process optimization. 76 projects were executed in the period of 2019 – 2022 (3 in 2019, 14 in 2020, 24 in 2021, and 35 in 2022). | CO2 CH4 N2O | Scope 1 | Reductions estimated through mass balance and/or emission factors in Ecopetrol’s own calculation model. | Implemented |
| Fugitive and vented emissions: Includes projects associated with the elimination of leaks and venting in the processes. 18 projects were executed in the period of 2019 – 2022 (6 in 2020, 8 in 2021, and 4 in 2022). | CH4 | Scope 1 | Reductions estimated through mass balance and/or emission factors in Ecopetrol’s own calculation model. | Implemented |
| Flaring optimization: Includes projects associated with the flaring optimization volumes through the sale, self-generation, or optimization of the process. 19 projects were executed in the period of 2019 – 2022 (2 in 2019, 6 in 2020, 9 in 2021, and 7 in 2022). | CO2 CH4 | Scope 1 | Reductions estimated through mass balance and/or emission factors in Ecopetrol’s own calculation model. | Implemented |
| Renewable energy: Includes projects associated with the generation of energy based on renewable sources. 7 projects were implemented in the period of 2019 – 2022 (1 in 2019, 2 in 2021, and 4 in 2022). | CO2 | Scope 2 | Reductions estimated through mass balance and/or emission factors in Ecopetrol’s own calculation model. | Implemented |
Note: Ecopetrol establishes an emissions reduction goal each year, which is defined based on the implementation of new projects in the different operating areas of the Company. For this report, projects of the same type were grouped into four (4) large programs defined in the climate change roadmap (energy efficiency, fugitive, and vented emissions, flaring optimization, and renewable energy). The reductions reported each year for the four (4) programs were estimated using the immediately preceding year as the reference year. Accordingly, N/A is selected in the box labelled “reference year for the calculation of reduction”.
(GRI 11-2-3) (TCFD M-1.2.1)
The implemented emission reduction projects are quantified through mass balance and emission factors. The reference emission factors below are used for the calculation:
- Compendium of Greenhouse Gas Emissions Estimation Methodologies for the Oil and Gas Industry
- FECOC
- UPME
- AP-42
Management Strategy for Fugitive
and Vented Emissions and Flaring
Ecopetrol has implemented a fugitive and vented emissions management strategy, approved in 2020 by the Executive Committee – ExCo, with the following lines of action:
Update and adjustment of the inventory, construction of own emission factors, and definition of reduction goals.
Incorporation of design criteria and best engineering practices to reduce fugitive and vented emissions.
Implementation of the methane emission leak detection and repair program (LDAR – Leak Detection and Repair).
Within the framework of the Coalition for Climate and Clean Air (CCAC), a UN-led initiative that Ecopetrol has been a member of since 2019, the Company adhered to OGMP 2.0 in 2020 (Oil and Gas Methane Partnership), by acquiring the following commitments:
- Defining a methane goal that leverages compliance with the sectoral goal proposed by CCAC member companies to reduce methane emissions by 45% by 2025 and between 60% to 75% by 2030 over the levels estimated for 2015.
- Reaching level 4/5 proposed by the CCAC, for which the following actions are necessary: i) increase direct measurements by combining bottom up and top down technologies, ii) calculate own emission factors, and iii) generate higher levels of transparency and credibility in the reports.
- Attaining measurement level 4/5 by 2024 in 100% of the assets operated directly, and by 2026, in 100% of the assets not operated directly.
The following activities have been furthered to meet these commitments:
- Detection and quantification of fugitive and vented emissions using different state-of-the-art technologies such as infrared cameras and flow meters (bottom up approach), as well as analysis of satellite images and flights with methane sensors (top down approach), covering close to 95% of the Company’s operations.
- Update and adjustment of the inventory based on own emission factors built from bottom up and top down measurements taken in the field.
- Repair program for identified leaks, repairing more than 1,800 leaks and reducing more than 100,000 tons of CO2e, including Hocol.

In 2023, the Company will establish its own methane emissions reduction goal in line with the provisions set forth by the CCAC.
With regard to the reduction of flaring, Ecopetrol aims to eliminate its routine flaring by 2030, in line with the World Bank’s “Zero Routine Flaring by 2030” initiative, through which it seeks to terminate routine flaring in existing fields as soon as possible and no later than 2030, and not conduct routine flaring in new oilfield developments.
Internal Carbon Price
In 2022, Ecopetrol approved the Internal Carbon Price as a mandatory variable, established as a base scenario in the economic evaluation to adopt current and future investment decisions. This scenario considers the impact of Scope 1 and 2 GHG emissions on Net Present Value (VPN, as per its Spanish acronym) and mitigation alternatives. The Company annually reviews the value assigned to the Internal Carbon Price, with a price curve that currently stands at 20 US/tCO2e and rises to 40 US/tCO2e by 2030.
(ECP 007) [gri src=”11-2-4″]
Participation in Climate
Change Public Policy
Ecopetrol takes on the challenges of the energy transition by seeking a balance between its contribution to mitigate the effects of climate change and the development and socioeconomic well-being of the country.
To this end, the Company contributes to the construction and discussion of climate change policies and regulations in different spaces and initiatives, both at the public and private level. Since 2022, it has been a member of Asocarbono (Colombian Association of Carbon Market Actors), whose purpose is to review government regulatory propositions and issue recommendations. Similarly, it is part of ANDI’s (National Association of Industrialists) environmental committee, where regulatory issues on climate change are discussed and proposals are generated in line with the purposes of each organization. At the public level, Ecopetrol has a direct relationship with the Ministry of Mines and Energy and the Ministry of Environment and Sustainable Development, to address the regulatory agendas of the oil and gas sector.
In 2022, we participated in the following regulatory consultations:
- Draft resolution “Regulating the conditions, criteria, and requirements for validation and verification processes in greenhouse gas mitigation initiatives and also issuing other provisions”.
- CONPES Document “Energy Transition Policy”.
- Foundations of the 2022-2026 National Development
- Plan, on issues related to climate change.
- Draft decree “Regulating Articles 22 and 57 of Law 2099 of 2021 issued by the MME on Carbon Capture, Use, and Storage (CCUS) technologies”.
- “Guidelines for the preparation of Comprehensive Management Plans for Business Climate Changes in the Mining and Energy Sector”.
- Draft decree for the modification of Carbon Tax-related articles under Decree 1076 of 2015 of the MHCP.
- Review of the considerations associated with carbon management in the Terms of Reference of ANH’s “Open Area Nomination Process – PANA”.
Roadmap
Integrated Water Management
Exceptional
Material Element
(GRI 3-3, 11-6-1) (WEF 7, 11E, 13E)
| Impacted stakeholder groups | Areas that manage the impacts | Ecopetrol business line or segments generating the highest impact |
|---|---|---|
| Society and Community | VRP | Upstream |
| State | VPU | Downstream |
| VHSE | ||
| VTI | ||
| VDS |
(GRI 3-3, 11-6-1) (WEF 7, 11E, 13E)
Why is the Element Material?
The impacts arising from the use and exploitation of water resources may be related to the effect on the water supply of the basins and on water quality. On the one hand, its extraction and consumption, given certain circumstances, could lead to changes in the availability of the resource for downstream users.
On the other hand, the discharges could change the quality of surface and underground water bodies.
The foregoing can generate impacts on the right to water and other related rights.
However, positive impacts are also generated on the environment through Integrated Water Management at Ecopetrol, in the form of conservation, restoration, and preservation of water basins, as well as improved access to drinking water and sanitation for the communities near the areas of operation of the Company.
The activities in the downstream, followed by the upstream, concentrate the largest volumes of deposits. However, the water consumption of the assets in no case exceeds 2.5% of the water supply of the basins, thus avoiding significant negative impacts on the water availability for downstream users.
On the other hand, the activities in the upstream, followed by the downstream, generate the largest volumes of industrial discharges into bodies of water. To prevent negative impacts from these discharges, environmental assessments are conducted from the planning stage based on the load and the assimilation and dilution capacity of the receiving body to confirm that no significant impacts are generated on them.
Ecopetrol treats 100% of its wastewater before it is discharged, thus ensuring compliance with the maximum permissible values established in environmental regulations. Quality monitoring is also conducted in the receiving bodies to confirm that they are not affected by the Company’s discharges.
Policies and Commitments
Responsible water management is a corporate responsibility that seeks to protect and preserve said resource and the availability thereof. It is also essential for the operating continuity of the different areas of the business. For this reason, integrated water management is classified as an exceptional
material element due to:
Its significance in the generation of ecosystem value in the short, medium, and long term.
It is included in the Company’s corporate risks.
Its relevance for the Stakeholder Groups, which is why water-related conflicts need to be prevented and water availability must be ensured for the environment.
Ecopetrol is publicly committed to sustainable water management by adhering to the CEO Water Mandate.

Towards water neutrality:
Ecopetrol declared its commitment to be water neutral by 2045, defined as the balance between the water required for operations and the direct water footprint, considering efforts to reduce it as much as economically and technically possible and subtracting the compensation of 100% of the remaining water required to operate by executing compensation projects in the water basins where it operates.
To this end, Ecopetrol has committed to a 66% reduction by 2045 in the catchment of fresh water for industrial use compared to the base year (2019), as well as the elimination of industrial wastewater discharges into fresh water bodies, and with the compensation of 34% of the remaining water consumption, through initiatives that contribute to improving water availability in the basins where the Company operates.
This ambition implies taking proactive actions, beyond environmental compliance, in order to manage the physical, regulatory, and reputational components of water-related risks and generate benefits for the community and the environment, with more control over the sustainability of the business in territories that gradually continue to raise their social and environmental protection expectations.
How is the Material
Element Managed?
Water neutrality is a strategic pillar of the environmental strategy, based on the integrated water management strategy, for which a roadmap has been defined to achieve
the goals set by 2045.
The roadmap establishes three (3) strategic lines of action:

01
Operational water management efficiency to reduce the catchment of fresh water, and the load and volume of discharges.
02
Integration of expertise and technology to enable cost-efficient measures for water reuse and recirculation, the reduction of production water on the surface, and the use of alternative water sources.
03
Sustainability and water security in the environment to improve the water conditions of the supply basins and ensure the remaining compensation for water neutrality.
How is the Material
Element Evaluated?
The water neutrality strategy is periodically evaluated using the following indicators:
Reduction in the volume of fresh water collected for industrial use.
Percentage of reuse of collected water and production water that leverages the reduction of fresh water catchment and discharges into surface water bodies.
Water volume to be reused in agroforestry activities.
(GRI 3-3-e) (WEF 7, 11E, 13E)
Short, Medium, and
Long term Goals and Projects
Short Term (2023—2025)
Short-term goals are defined every year by means of the three (3) year business plan to advance towards the fulfillment of long term goals.
In this sense, the goals set for 2023* are indicated below:
Maximum catchment limit: 724 KBWPD, that is, a 12% reduction compared to the baseline.
Reuse of production water: 31.5%
Reuse of collected fresh water: 40.1%
Reuse of 60 KBWPD of treated production water in agroforestry cultivation pilot.
* The goals include the commitments adopted by the Upstream and Downstream Vice Presidencies, as well as the incorporation of the Tren Nare assets operated by Ecopetrol since November 2021.
Long Term (>2030)
The water neutrality commitment includes the following goals by 2045:
66% reduction of freshwater catchment for industrial use, compared to the baseline year (2019)**.
Zero industrial discharges into bodies of fresh water.
Compensation of the remaining catchment (34%) through compensation projects in the
same basins from which the water is extracted.
** If new assets are received, their water management volumes will be included in the baseline to maintain comparability with it.
(GRI 3-3-e) (WEF 7, 7E, 11E, 13E)
Main Achievements in Managing the
Integrated Water Management Roadmap
26% reduction25 in the volume of water collected for industrial use, thereby meeting the projected 14% goal for 2022.
Reuse of 131.5 million m3 (77.5% of the water required to operate).
58% increase in the volume of reused production water.
Deep aquifers: establishment of the local isotopic baseline and hydrochemical model for the Valle Medio del Magdalena aquifer system.
Completion of early water polishing tests.
100% of assets operated with water footprint calculation, four (4) of them verified by Icontec.
Completion of the short, medium, and long term water availability study.
Updating and monitoring of the hydrological environmental baseline and surface water
quality of Valle Medio del Magdalena.
Reuse of 3.8 million m3 of production water in agroforestry crops.
Progress in the collective action mechanism for the management of water security in Villavicencio and Acacias, together with 11 public and private entities.
(GRI 303-1, 11-6-2) (WEF 11E) (TCFD M-1.1)
Interaction with Water as a Shared Resource and Management of Discharge-related Impacts
131.5 million m3 of water were used in 2022, equivalent to 77.5% of the total required to operate, which represents an 18% increase compared to the previous year, as a consequence of larger volumes of production water reused for recovery, mainly in the Castilla, Casabe, and Rubiales fields and larger volumes of water collected reused in the Barrancabermeja refinery.
On the other hand, 38.1 million m3 of fresh water were collected from surface, underground, and aqueduct sources, equivalent to 22.5% of the water required to operate, thus registering a 6% decrease in catchments compared to 2021 (-13% without including the Tren Nare), mainly due to the entry into operation of the Casabe Field Reinjection Plant, which reduced catchments by 90%. 61% of total catchments derived from surface sources, 19% from underground, and 20% from aqueducts and external suppliers, through 104 water catchment points in 23 basins.
In terms of effluent management, 430.6 million m3 of production water (11% more than in 2021 and, on average, 11 barrels of water per barrel of crude oil extracted) and 34.5 million m3 of wastewater were generated from the use of collected water and the intake of rainwater in the treatment systems.
58% of production water was reinjected for final disposal, 26% was reused mainly in reinjection for recovery purposes, 15% was discharged into bodies of water (prior treatment), and 1% was reused in the irrigation of agroforestry crops in the Agro-energy Sustainable Area (ASA) of Castilla.
The Company’s total discharges, including wastewater from all segments, amounted to 80.3 million m3, which represents a 23% increase compared to the previous year, mainly due to the impact of closing the discharge of the Castilla field, which was reactivated in June 2021. The upstream segment generated 81.3% of total discharges (mainly production waters), downstream accounted for 18.6%, and corporate areas 0.1%.
95.8% of the discharges were into surface water bodies, 3.2% into the sea, 0.8% into the ground, and 0.2% of discharges in 23 water basins were delivered to external managers and sewers. The upstream segment generated 81.3% of total discharges (mainly production waters), downstream accounted for 18.6%, and corporate areas 0.1%. In total, 21 basins were used for the disposal of discharges.

The entry into operation of the Casabe Field Reinjection Plant reduced by 90% water catchment.
Environmental planning identifies the potential impacts that each operation or project can generate on water bodies, determining their supply and quality conditions and defining the management measures in the environmental management plans. The impacts can be mainly related to a potential effect on the water supply and quality of the basin for downstream users. However, in addition to avoiding the materialization of negative impacts, Ecopetrol also generates positive impacts on the environment through its Integrated Water Management, in terms of conserving, restoring, and preserving water basins, as well as improving access to drinking water and sanitation in the communities near the areas of operation.
To avoid the materialization of negative impacts, the environmental assessment is conducted from the planning phase of the projects and operations, which defines the conditions (i.e. maximum use flows, ecological flow, use restrictions in periods of less rainfall, operating times, discharge volumes, flows to guarantee dilution/assimilation, among others) for the use of water in operations so as to not generate a significant impact on the availability or quality of the resource. These conditions are subject to the approval of an environmental permit by the competent authority, which is generally an integral part of the environmental license. In the operating phase, Efficient Use and Water Saving Programs (PUEAA, as per its Spanish acronym) are implemented to optimize the use of fresh water collected through reuse or recirculation initiatives, which in turn reduce discharges.
Similarly, the resource is continuously monitored to determine the supply conditions and quality of the water bodies and discharges, so that no discharges are not made if the dilution capacity lowers during the periods of less precipitation, for example. The monitoring results are recorded in the SIGAR – Water tool to identify any deviations and trigger the corresponding action plans. These are also reported periodically in the Environmental Compliance Reports (ICA, as per its Spanish acronym) for verification and monitoring purposes by the environmental authority.
The Company has robust treatment systems to remove pollutants in wastewater, and thus meet the quality standards established in environmental regulations for discharges into bodies of surface water, seawater, or into the ground. These quality criteria are defined by the competent environmental authorities, who determine the maximum permissible limits for discharges into surface water bodies and sewers (Resolution 631 of 2015), seawater (Resolution 0883 of 2018), and to the ground (Decree 1076 of 2015), for each productive sector of the industry. For the specific case of the hydrocarbon sector, the most relevant parameters and their maximum limits were defined for each activity in the value chain (exploration, production, refining, and transportation), with more than 40 quality parameters in mind.
The strategic line of knowledge integration chases after technological alternatives through polishing pilots, enrichment with nano fertilizers, and optimizations in the reuse of treated production water for irrigation in agroforestry activities.
It is worth noting that conversion plans to clean technologies have been implemented, which have improved the quality of discharges and eliminated more than 5 million m3/year of industrial discharges.
(GRI 303-1-b, 303-2-a, 11-6-2) (TCFD M-1.1)
Water Footprint
Ecopetrol uses the water footprint methodology in direct operation assets based on the provisions of the ISO 14046:2014 standard and the Water Footprint Network WFN, respectively, to identify impacts and show the benefits of reducing pressure on water resources by implementing measures to achieve operating efficiency in water management, as well as decarbonization and circular economy initiatives. Based on the analysis of the indirect water footprint, the raw materials and inputs that generate the highest impact have been identified, as well as the product and service suppliers that could adopt initiatives to reduce water-related risks.
This methodology is based on the following impact indicators:
1
Consumption footprint:
Extracted fresh water that evaporates or is incorporated into the product, or is not returned to the basin.
2
Water scarcity footprint:
Impact of water consumption with respect to available fresh water.
3
Degradation footprint:
Deterioration of the quality of fresh water due to the presence of polluting substances. It also allows the identification of priority substances in the discharges with the following indicators:
- Human toxicity: based on the USEtox model, which appraises the hazard of wastewater discharges in terms of carcinogenic and non-carcinogenic toxicity for humans (CTUh).
- Ecotoxicity in freshwater: based on the USEtox model, which evaluates various toxicological mechanisms caused by the release of substances with a direct effect on the health of the ecosystem (CTUe).
- Ecotoxicity of seawater: based on the Recipe model.
- Freshwater acidification: based on the Accumulated Exceedance AE model, which assesses the effect of acid rain on freshwater due to the release of NOx, SOx, and NH3 into the atmosphere.
In 2022, Ecopetrol became the first company in the hydrocarbon sector to verify its water footprint in the country and in Latin America. This calculation was made in accordance with the NTC-ISO 14046 standard for 100% of the operated assets, and the verification process of the water footprint calculation was conducted in partnership with ICONTEC for the La Cira – Infantas and Castilla Fields and the Cartagena and Barrancabermeja refineries.
Goal Setting Process:
Setting goals is a collaborative effort between the operating areas and the HSE Vice Presidency, considering the Company’s TESG strategy, Business Development Plans, and best practices in the sector. The goals are built using a bottom up strategy, that is, they are arranged for each asset, and then they are grouped to define the goals by segment and for the entire Company. Subsequently, they are made official by the HSE Vice President, and the follow-up is conducted on a monthly basis by the same HSE Vice President and the Department of Business Performance.
Ecopetrol sets water-related goals to reduce its footprint and dependence on the availability of fresh water, which allows it to manage the physical, regulatory, and reputational risks in each of the basins where the operation or project is taking place, and also to increase the resilience of operations in the territories that progressively raise their social and environmental expectations.
Monitoring the Effectiveness of the Measures Adopted
The effectiveness of the water management measures adopted is measured in terms of:
- Legal compliance with environmental requirements, especially by monitoring the supply conditions and quality of the water bodies in the area of influence.
- Formulation and fulfillment of internal goals that leverage the ambition of being water neutral, including fresh water catchment limits for industrial use, the percentage of water reuse, the production water reuse target, concentration of hydrocarbons in discharges, and the gradual reduction of discharges until complete phase out.
- Water risk management (physical, regulatory, or reputational) through the Comprehensive Risk Management System.
- Analysis of water-related requests, complaints, and claims (PQRs).
- Rating in reports to stakeholders such as DJSI, CDP, Sustainalytics, etc.
- Internal audits on the efficient use of water resources.
- Monitoring by environmental authorities and compliance with the requirements arising from the visits and oral hearings held with environmental authorities.

Lessons Learned and Incorporation into the
Company’s Operating Policies and Procedures
Water is a fundamental resource for Ecopetrol’s operations and projects, which is why the goal of Water Neutrality by 2045 was included in its 2040 Strategy: “Energy that Transforms,” under the “Generating Value with TESG” pillar.
This is a strategic pillar defined in the Environmental Strategy, established within the framework of the HSE Management System certified by ISO 14001 (V2015). In this sense, there is a management program for all environmental strategic pillars containing goals and milestones that are monitored quarterly by the HSE Vice Presidency.
Additionally, Ecopetrol included Risk 14 on “Inadequate climate change and water management” in its Business Risk Map, which continuously identifies water-related risks, and evaluates and anticipates possible scenarios that may affect the continuity of the operations and proposes measures to minimize exposure.
Part of the analysis includes reviewing materialized events or that may have potentially materialized, in which physical, regulatory, and/or reputational conditions could affect the continuity of the operations. The foregoing, with the purpose of including lessons learned in the asset development plan, and extrapolating them to other assets that could be exposed to the same situation. The risk scenarios serve as an input for the Company’s materiality analysis, which, together with the perception of Stakeholder Groups, allowed the definition of integrated water management as an exceptional element within the TESG pillar.
The reports to stakeholders such as DJSI, CDP, and Sustainalytics, and the standards of organizations such as GRI and IPIECA, have allowed the Company to compare and evaluate its integrated water management with respect to the best practices and global trends in the Oil & Gas sector, and update its internal policies and procedures accordingly.
The CDP (Disclosure Insight Action) gave Ecopetrol an A- rating for its results and leadership in the development of its 2022 Climate Change program, positioning the Company as an industry benchmark in the subject matter at the regional and internal level. In the 2020 and 2021 reports, Ecopetrol obtained a rating of C and C-, which implied an exhaustive review of the gaps to establish robust actions for improvement and report on the efforts made in climate change. The rating outperforms the industry average with a B, and regional and global performances with a C.
How are Stakeholders Involved in Taking Action to Manage Water in a Comprehensive Manner?
The communities in the areas of influence are active players in the early planning stages of new projects or the modification of existing operations, since they participate in three instances during the preparation of environmental impact assessments when formulating the request for environmental licensing. There are similarly additional participation mechanisms during the evaluation of the application, such as environmental public hearings, prior consultations with indigenous communities, and third-party declarations.
Once the permits have been granted, the community actively engages in the operating stage, with the possibility of exerting surveillance and control over its evolution, participating in technical follow-up visits by the environmental authority, rights to petition, and environmental complaints. On the other hand, Ecopetrol (through the Citizen Participation Office, OPC) has implemented mechanisms to receive and manage requests, complaints, claims, and suggestions (PQRS) filed by the Stakeholder Groups, as well as participation scenarios to report on the activities undertaken in order to build close relationships with the stakeholders.
The district, regional, and national environmental authorities are in charge of issuing environmental authorizations on behalf of the State, and also monitoring compliance with the commitments included in the Environmental Management Plan,
in order to prevent, mitigate, correct, and/or offset the environmental impacts identified. By means of follow-up orders and/or oral proceedings, the authorities can establish additional requirements for the Company.
For Ecopetrol, it is important to support and be associated with the efforts exerted on water security at the international and national levels, which is why it participates in the following initiatives: The CEO Water Mandate and the Water Coalition for Colombia (Coalición Agua para Colombia). Currently, the water security plans promoted by Ecopetrol are part of the global collaboration and knowledge exchange platform for water sustainability and climate resilience -Water Action Hub.
At the regional level, together with The Nature Conservancy (TNC), the design stage of the collective action mechanism continued in 2022 for the management of water security in the supply basins of the municipalities of Villavicencio and Acacias, together with 11 public and private entities that have formalized their engagement by signing of a memorandum of understanding. Currently, the mechanism has a portfolio of Nature-Based Solution initiatives and an investment return analysis pertaining to water security benefits for these two municipalities.
On the other hand, in partnership with the Institute of Hydrology, Meteorology, and Environmental Studies (IDEAM), the state of the surface water has been updated and monitored since 2021, as well as the generation of hydrometeorological alerts in Valle Medio del Magdalena, contributing to decision-making on water planning and management processes, in order to prevent and mitigate future impacts from hydroclimatic events in 39 municipalities in the departments of Santander, Norte de Santander, Cesar, and Bolívar, and benefiting around two (2) million inhabitants in this region.
Finally, progress is being made in the conservation of natural capital and biodiversity, through voluntary efforts and compliance with environmental compensation obligations, and a 1% investment to contribute to the conservation, recovery, and monitoring of water resources in the basins that supply the operations.

The water security plans promoted by Ecopetrol are part of the global collaboration and knowledge exchange platform for water sustainability and climate resilience - Water Action Hub.
| Water extraction in all areas | Unit of measurement | 2019 | 2020 | 2021 | 2022 |
|---|---|---|---|---|---|
| Total extractionin all areas | m3 | 453,769,052 | 454,657,524 | 428,242,738 | 468,640,838 |
| Total surface water | m3 | 38,368,623 | 34,465,016 | 24,326,162 | 23,132,391 |
| Surface: Fresh water (total dissolved solids ≤1,000mg/l) | m3 | 38,368,623 | 34,465,016 | 24,326,162 | 23,132,391 |
| Surface: Other waters (total dissolved solids >1,000mg/l) | m3 | 0 | 0 | 0 | 0 |
| Total underground water | m3 | 8,459,395 | 9,346,929 | 8,771,134 | 7,214,821 |
| Underground: Fresh water (total dissolved solids ≤1,000mg/l) | m3 | 8,459,395 | 9,346,929 | 8,771,134 | 7,214,821 |
| Underground: Other waters (total dissolved solids >1,000mg/l) | m3 | 0 | 0 | 0 | 0 |
| Total sea water | m3 | 0 | 0 | 9,671 | 0 |
| Sea water: Fresh water (total dissolved solids ≤1,000mg/l) | m3 | NA | NA | NA | NA |
| Sea water: Other waters (total dissolved solids >1,000mg/l) | m3 | 0 | 0 | 9.671 | 0 |
| Total aqueducts | m3 | 7,800,432 | 7,301,149 | 6,983,431 | 7,742,572 |
| Aqueducts: Fresh water (total dissolved solids ≤1,000mg/l) | m3 | 7,800,432 | 7,301,149 | 6,983,431 | 7,742,572 |
| Aqueducts: Other waters (total dissolved solids >1,000mg/l) | m3 | 0 | 0 | 0 | 0 |
| Total production water | m3 | 399,140,602 | 403,544,430 | 388,152,340 | 430,551,054 |
| Total production water: Fresh water (total dissolved solids ≤1,000mg/l) | m3 | 91,617,606 | 100,149,960 | 302,002,858 | 338,212,508 |
| Total production water: Other waters (total dissolved solids >1,000mg/l) | m3 | 307,522,996 | 303,394,470 | 86,149,482 | 92,338,546 |
ote 1: In 2022, 38.2 million m3 of fresh water was collected, which represents a 5% reduction compared to 2021. This reduction was mainly thanks to the entry into operation of the Casabe reinjection plant, which reduced 89% of underground water catchment (-4.3 million m3). On the other hand, the Tibú field also experienced reductions (-0.6 million m3) in the catchment of underground water due to law and order conditions that affected its normal operation. In terms of surface catchments, reductions were recorded in La Cira Infantas (-0.54 million m3), which required less water collected for injection due to an increase in the BSW of its wells; also, in the Barrancabermeja refinery (-0.66 million m3) due to higher water reuse. As for aqueducts, there was an increase in the volume of water purchased by the Cartagena refinery (+10%) due to the entry into operation of the IPCC Crude Plant, which increased the load of refined crude and, consequently, water demand.
It is important to mention that the volumes for 2022 include the Tren Nare, operated by Ecopetrol since November 2021, which represented an additional collection of 3.28 million m3/year above the baseline. Without this effect, the reduction compared to 2021 would have been 12%.
Note 2. An 11% increase in production water was recorded, due to the temporary closure of the discharge from the Castilla field during the first half of 2021, which operated normally throughout 2022; also, the Tren Nare fields contributed 3.2 million m3 to water production.
| Water extraction by water stressed areas | Unit of measurement | 2019 | 2020 | 2021 | 2022 |
|---|---|---|---|---|---|
| Total extraction by water stressed areas | m3 | 25,201,651 | 23,455,522 | 24,647,117 | 24,500,595 |
| Total surface water | m3 | 4,066,730 | 3,230,981 | 4,004,994 | 2,712,030 |
| Surface: Fresh water (total dissolved solids ≤1,000mg/l) | m3 | 4,066,730 | 3,230,981 | 4,004,994 | 2,712,030 |
| Surface: Other waters (total dissolved solids >1,000mg/l) | m3 | 0 | 0 | 0 | 0 |
| Total underground water | m3 | 248,204 | 69,217 | 84,091 | 118,019 |
| Underground: Fresh water (total dissolved solids ≤1,000mg/l) | m3 | 248,204 | 69,217 | 84,091 | 118,019 |
| Underground: Other waters (total dissolved solids >1,000mg/l) | m3 | 0 | 0 | 0 | 0 |
| Total sea water | m3 | 0 | 0 | 9,671 | 0 |
| Sea water: Fresh water (total dissolved solids ≤1,000mg/l) | m3 | NA | NA | NA | NA |
| Sea water: Other waters (total dissolved solids >1,000mg/l) | m3 | 0 | 0 | 9,671 | 0 |
| Total aqueducts | m3 | 7,740,246 | 7,220,210 | 6,969,932 | 7,707,270 |
| Aqueducts: Fresh water (total dissolved solids ≤1,000mg/l) | m3 | 7,740,246 | 7,220,210 | 6,969,932 | 7,707,270 |
| Aqueducts: Other waters (total dissolved solids >1,000mg/l) | m3 | 0 | 0 | 0 | 0 |
| Total production water | m3 | 13,146,471 | 12,935,114 | 13,578,429 | 13,963,276 |
| Total production water: Fresh water (total dissolved solids ≤1,000mg/l) | m3 | 0 | 0 | 0 | 0 |
| Total production water: Other waters (total dissolved solids >1,000mg/l) | m3 | 13,146,471 | 12,935,114 | 13,578,429 | 13,963,276 |
Note: Water stressed areas are identified when the ratio between surface water demand and supply in the basin is greater than 40%. The assets of Llanito, Lisama, Neiva, Tello, Río Ceibas, and Yaguará are under this condition, as well as the Cartagena refinery and the San Silvestre plant at the Barrancabermeja refinery. Total fresh water collected in these areas recorded a 4% decrease due to lower catchment at the Barrancabermeja refinery.
| Water reuse | Unit of measurement | 2019 | 2020 | 2021 | 2022 |
|---|---|---|---|---|---|
| Total water reuse | m3 | 89,395,780 | 96,524,057 | 111,261,921 | 131,542,527 |
| Reuse of collected water | m3 | 16,971,337 | 11,364,661 | 16,872,526 | 16,913,485 |
| Reuse of production water | m3 | 72,424,443 | 85,159,396 | 94,389,395 | 114,611,042 |
Note: A total of 131.3 million m3 were reused, which represents an 18% increase vs. 2021, mainly due to an increase in water reinjection for recovery in the Castilla field (+12.8 million m3); the entry into operation of the reinjection plant at the Casabe field (+5.2 million m3); the start of the reinjection pilot to sustain pressure in the Rubiales field (+1.4 million m3); higher water production in the Chichimene and Akacias fields, which reinject 100% of the water for recovery (+0.7 million m3), and higher reuse of industrial water at the Barrancabermeja refinery (+0.6 million m3).
| Effluent management | Effluent management | 2019 | 2020 | 2021 | 2022 |
|---|---|---|---|---|---|
| Reuse | m3 | 89,395,780 | 96,524,057 | 111,261,921 | 131,524,527 |
| Reuse | m3 | 1,159,113 | 3,134,494 | 2,304,548 | 3,767,340 |
| Disposal | m3 | 249,338,950 | 245,428,556 | 246,939,985 | 249,517,246 |
| Discharges | m3 | 96,686,359 | 87,278,245 | 61,554,806 | 80,253,356 |
| Total effluents | m3 | 436,580,202 | 432,365,352 | 422,061,260 | 465,062,469 |
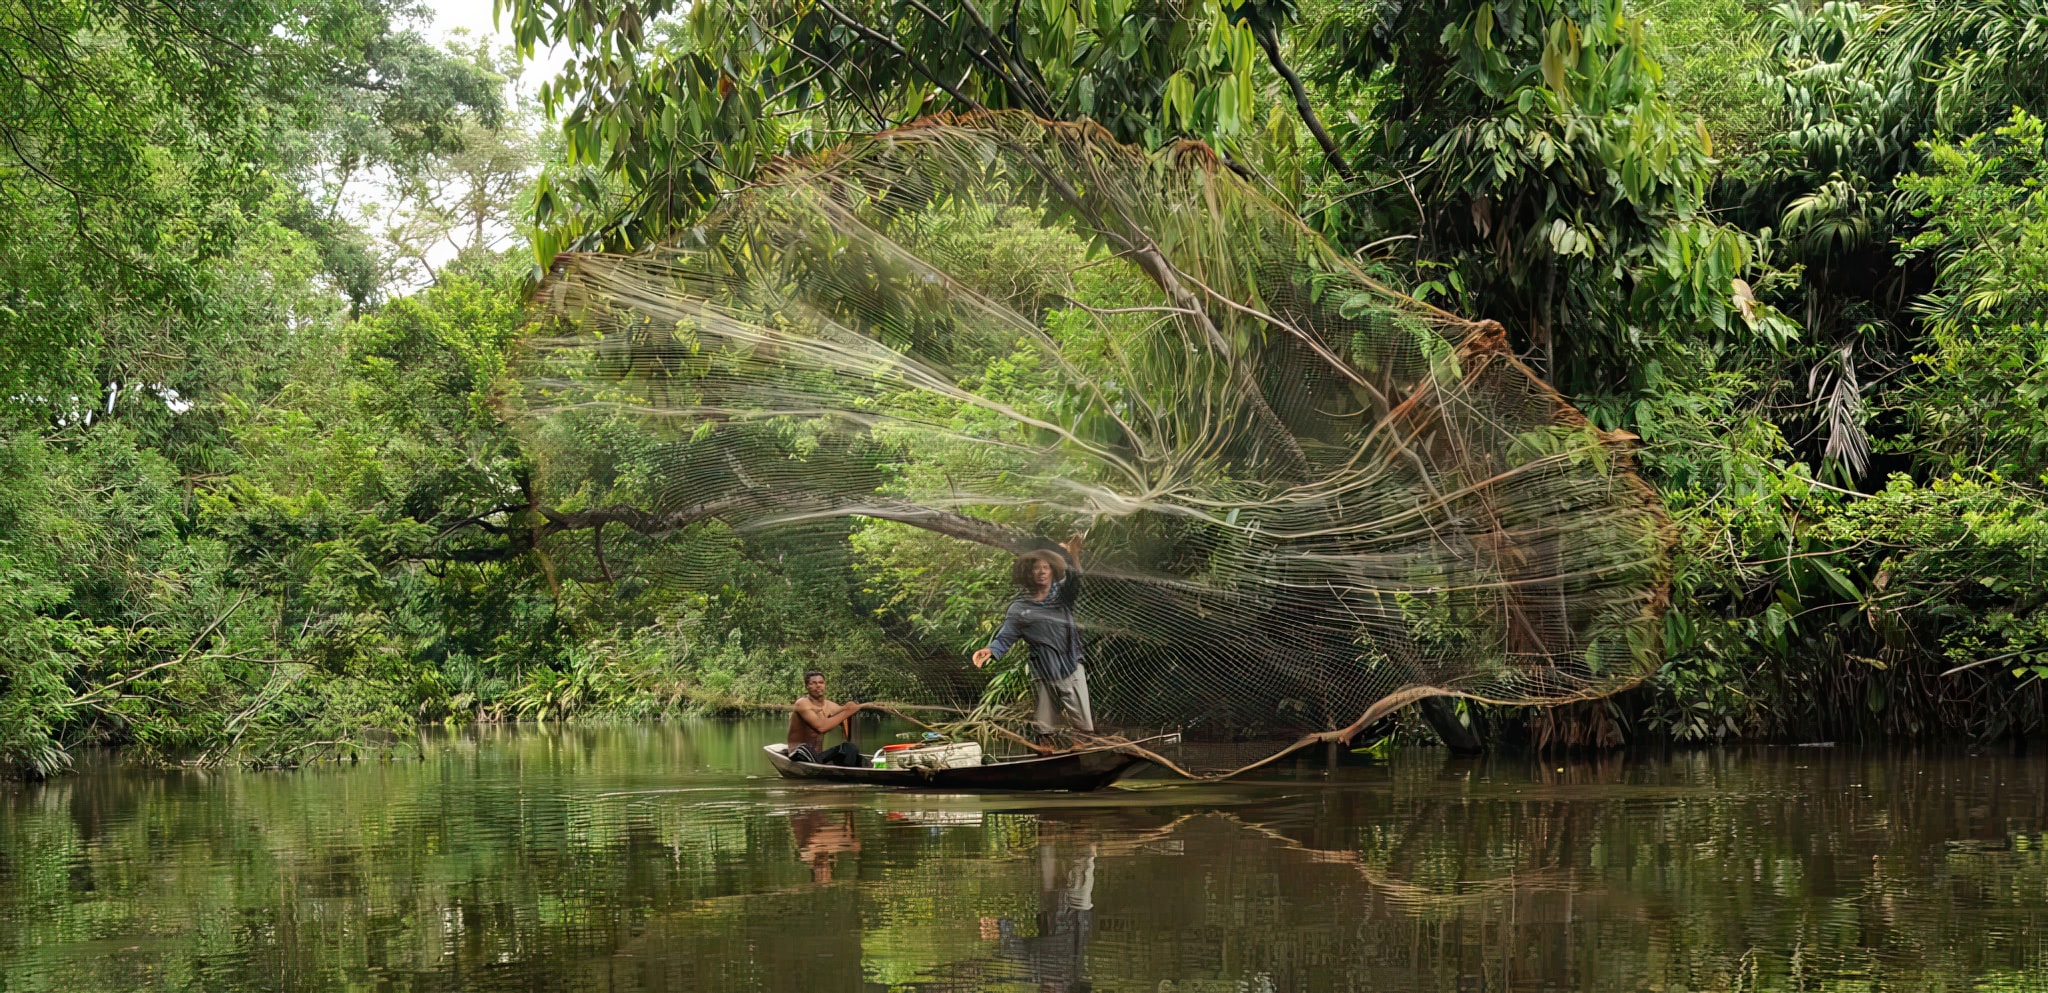
| Water discharge in all areas | Unit of measurement | 2019 | 2020 | 2021 | 2022 |
|---|---|---|---|---|---|
| Surface water | m3 | 93,034,569 | 83,941,847 | 58,198,876 | 76,874,598 |
| Sea water | m3 | 26,71,317 | 2,359,516 | 2,508,397 | 2,574,040 |
| Soil water | m3 | 849,601 | 848,655 | 750,635 | 623,646 |
| Sewage water | m3 | 130,872 | 128,227 | 96,898 | 181,071 |
| Total freshwater discharges (total dissolved solids ≤1,000mg/l) | m3 | 65,702,984 | 56,871,728 | 45,831,586 | 69,631,981 |
| Total discharges from other waters (total dissolved solids >1,000mg/l) | m3 | 30,983,375 | 30,406,517 | 15,723,220 | 10,621,375 |
Note: Discharges amounting to 80.3 million m3 were recorded, representing a 30% increase compared to 2021 due to the reactivation of the discharge (surface) in Castilla. However, it is important to highlight the reductions resulting from the implementation of the PRTLGV (Reconversion Plan to Clean Technologies in Discharge Management) in Casabe and Llanito (surface, non-fresh water), the closure of the muddy water discharge in La Cira Infantas (-0.39 million m3), and less discharge in the Barrancabermeja refinery (-0.38 million m3).
(GRI 11-6-5) (TCFD M-1.1)
| Water discharge in water stressed areas | Unit of measurement | 2019 | 2020 | 2021 | 2022 |
|---|---|---|---|---|---|
| Surface water | m3 | 531,676 | 480,099 | 583,515 | 56,131 |
| Sea water | m3 | 2,669,288 | 2,338,819 | 2,508,397 | 2,574,040 |
| Soil water | m3 | 276,370 | 139,979 | 106,951 | 90,844 |
| Sewage water | m3 | 61,401 | 19,120 | 0 | 10,133 |
| Total freshwater discharges (total dissolved solids ≤1,000mg/l) | m3 | 464,142 | 256,758 | 179,581 | 152,317 |
| Total discharges from other waters (total dissolved solids >1,000mg/l) | m3 | 3,074,594 | 2,721,260 | 3,019,282 | 2,578,831 |
Note: Total discharge in water stressed areas amounted to 2.7 million m3, that is, a 16% reduction compared to 2021; discharges to surface water were reduced by 91% thanks to the closing of the discharge in the Llanito field.
(GRI 11-6-5) (TCFD M-1.1)
| Discharge by level of treatment | Unit of measurement | 2019 | 2020 | 2021 | 2022 |
|---|---|---|---|---|---|
| No treatment | m3 | 0 | 0 | 0 | 0 |
| Pre-treatment | m3 | 0 | 0 | 0 | 0 |
| Primary treatment | m3 | 9,475,971 | 3,844,372 | 4,301,992 | 4,585,760 |
| Secondary treatment | m3 | 87,081,370 | 83,318,578 | 57,196,554 | 75,552,823 |
| Tertiary treatment | m3 | 1,693 | 44 | 0 | 0 |
| Other treatments | m3 | 127,325 | 115,251 | 56,260 | 114,772 |
Note: In primary treatments, discharges with exclusively physical treatments are reported; secondary treatments involve biological treatments; tertiary treatments include advanced treatments such as reverse osmosis. The volume reported under “Other treatments” corresponds to wastewater managed with external parties, who cover their own treatment and final disposal.
(SASB EM-EP-140a.1) (SFC XVI) (TCFD M-1.1)
| Fresh water collected and consumed | Unit of measurement | 2019 | 2020 | 2021 | 2022 |
|---|---|---|---|---|---|
| Amount of water extracted from freshwater sources | Thousand m3 | 23,317 | 23,467 | 11,561 | 9,607 |
| Amount of fresh water consumed in company operations | Thousand m3 | 13,568 | 12,784 | 10,052 | 8,695 |
| Amount of water extracted from places under high or extremely high water stress | Thousand m3 | 447 | 138 | 111 | 171 |
| Amount of water consumed in places under high or extremely high water stress | Thousand m3 | 27 | 0 | 0 | 19 |
| Percentage of water extracted from places under high or extremely high water stress | % | 3 | 1 | 1 | 1.78 |
| Percentage of water consumed in places under high or extremely high water stress | % | 0 | 0 | 0 | 0.219 |
Note 1. Point 1: in 2022, the E&P segment collected 9 million m3 of fresh water, which represents a 17% reduction compared to 2021. This reduction mainly due to: the entry into operation of the Casabe Reinjection Plant, which reduced -4.3 million m3; lower underground water catchment in the Tibú field (-0.6 million m3) due to law and order conditions that affected its normal operation; lower surface catchments in La Cira Infantas (-0.54 million m3), which required less water collected for injection due to an increase in the BSW of its wells.
ote 1: In 2022, 38.2 million m3 of fresh water was collected, which represents a 5% reduction compared to 2021. This reduction was mainly thanks to the entry into operation of the Casabe reinjection plant, which reduced 89% of underground water catchment (-4.3 million m3). On the other hand, the Tibú field also experienced reductions (-0.6 million m3) in the catchment of underground water due to law and order conditions that affected its normal operation. In terms of surface catchments, reductions were recorded in La Cira Infantas (-0.54 million m3), which required less water collected for injection due to an increase in the BSW of its wells; also, in the Barrancabermeja refinery (-0.66 million m3) due to higher water reuse. As for aqueducts, there was an increase in the volume of water purchased by the Cartagena refinery (+10%) due to the entry into operation of the IPCC Crude Plant, which increased the load of refined crude and, consequently, water demand.
It is important to mention that the volumes for 2022 include the Tren Nare, operated by Ecopetrol since November 2021, which represented an additional collection of 3.28 million m3/year above the baseline. Without this effect, the reduction compared to 2021 would have been 12%.
Note 2. An 11% increase in production water was recorded, due to the temporary closure of the discharge from the Castilla field during the first half of 2021, which operated normally throughout 2022; also, the Tren Nare fields contributed 3.2 million m3 to water production.
(SASB EM-EP-140a.2) (SFC XVI) (TCFD M-1.1)
| Produced water, flowback, and hydrocarbons contained in the discharges generated in the operation | Unit of measurement | 2019 | 2020 | 2021 | 2022 |
|---|---|---|---|---|---|
| Amount of produced water generated during operation | Thousand m3 | 399,141 | 403,545 | 388,370 | 430,551 |
| Amount of flowback generated during operation | Thousand m3 | NA | NA | NA | NA |
| Amount of produced water and flowback generated during operation | Thousand m3 | 399,141 | 403,545 | 388,370 | 430,551 |
| Amount of produced water and flowback injected | Thousand m3 | 321,024 | 330,274 | 341,199 | 249,517 |
| Percentage of water produced and flowback injected | % | 62.5 | 60.5 | 63.4 | 57.953 |
| Amount of produced water and flowback recycled | Thousand m3 | 73,584 | 88,294 | 96,703 | 118,378 |
| Percentage of water produced and flowback recycled | % | 18.4 | 21.8 | 24.8 | 27.495 |
| Amount of produced water and flowback discharged | Thousand m3 | 76,241 | 72,047 | 45,770 | 64,336 |
| Percentage of water produced and flowback discharged | % | 19.1 | 17.8 | 11.8 | 14.943 |
| Amount of hydrocarbons contained in the water discharged into the environment | Ton | 225 | 386.6 | 101.8 | 127 |
Note 1. Data reported from the exploration and production segment of the hydrocarbons business line.
Note 2. Ecopetrol does not conduct hydraulic fracturing activities, thereby not generating any flowback.
Note 3. The volume of produced water injected includes the water injected for final disposal.
Note 4. The volume of production water recycled includes reinjection for recovery (EOR).
Note 5. The weighted average concentration of HTP in the discharges from Ecopetrol’s exploration & production assets is 1.97 mg/L, well below the limit of 10 mg/L established by national regulations.
Percentage of hydraulically fractured sites where surface and underground water suffer quality deterioration compared to a baseline.
Ecopetrol does not conduct hydraulic fracturing activities, thereby not generating any flowback.

Water Consumption
| Water consumption | Unit of measurement | 2019 | 2020 | 2021 | 2022 |
|---|---|---|---|---|---|
| Entry into operation | m3 | 25,201,651 | 23,455,522 | 24,647,118 | 24,500,595 |
| Fresh water catchments | m3 | 12,055,180 | 10,520,408 | 11,068,689 | 10,537,319 |
| Production water | m3 | 13,146,471 | 12,935,114 | 13,578,429 | 13,963,276 |
| Effluents | m3 | 16,558,284 | 15,485,835 | 16,178,556 | 16,554,814 |
| Collected water injected for recovery | m3 | 233,654 | 40,927 | 80 | 36,925 |
| Drinking water supplied to third parties (communities) | m3 | 95,119 | 4,448 | 0 | 0 |
| Production water reinjected for recovery | m3 | 12,690,776 | 12,462,441 | 12,979,613 | 13,786,741 |
| Production water reinjected for final disposal | m3 | 0 | 0 | 0 | 0 |
| Production water reused in agricultural irrigation | m3 | 0 | 0 | 0 | 0 |
| Discharges | m3 | 3,538,736 | 2,978,018 | 3,198,863 | 2,731,148 |
| Balance (consumption) | m3 | 8,643,367 | 7,969,687 | 8,468,562 | 7,945,781 |
Roadmap
Biodiversity and Ecosystem Services
Notable
material element
(GRI 3-3, 11-6-1) (WEF 7, 11E, 13E)
| Impacted stakeholder groups | Areas managing the impacts | Ecopetrol business line or segments generating the highest impact |
|---|---|---|
| Suppliers | VHSE | Upstream |
| Associates and Partners | Midstream | |
| Customers | Downstream | |
| Employees | ||
| Investors | ||
| State | ||
| Society and Community |
Why is the Element Material?
biodiversity from the presence of hydrocarbon operations and projects can be generated in the use of the soil (transformation), forest exploitation, contamination, and the effect on the species in red list categories. In turn, positive impacts are generated on biodiversity and local communities, to the extent that there is better integration between the company’s operation and the environment, with soil conservation and restoration efforts, generation of biological corridors, implementation of sustainable systems (agroforestry, silvopastoral, meliponiculture, etc.), participatory monitoring programs, and registration of biological information in the SIB, among others.
These impacts can similarly affect or boost the well-being and sustenance of the surrounding communities, in relation to the rights to a healthy environment and access to water, and others.
Ecopetrol recognizes the need to identify and manage the dependencies and impacts on biodiversity and ecosystem services, as well as the need to apply the mitigation hierarchy and trigger actions that contribute positively to nature, in line with the UN’s Sustainable Development Goals.
In this sense, the Company defined Biodiversity and Ecosystem Services as a notable element, considering the risks and opportunities entailed in operating in a megadiverse country, while adequately managing biodiversity, meeting the expectations of the Stakeholder Groups, and maintaining the license to operate.
An inadequate management of biodiversity and ecosystem services can have strong impacts on Ecopetrol’s operations due to possible dependencies that may arise throughout execution.
Policies and Commitments
The environmental strategy includes the strategic pillar of Biodiversity and Ecosystem Services, in coordination with the “Generating Value with TESG” driver under the Company’s 2040 Strategy.
The objective of this pillar is to undertake harmonious operations in balance with the environment, while progressively reducing potential risks and impacts on the ecosystems and local communities.
Ecopetrol has not, nor does it plan to conduct exploration, production, or refining activities in areas of great biodiversity value, categories I to IV according to the IUCN, nor in areas declared World Heritage Sites by UNESCO.
Ecopetrol actively supports Target 15, recently included in the Convention on Biological Diversity (CBD), as an active member of the Taskforce on Nature-Related Financial Disclosures (TNFD).
As an active member of the TNFD, it is committed to adopting this framework for managing and reporting risks and opportunities associated with natural capital, to actively contribute to an ever-growing ambition of a positive nature, in pursuit of halting and reversing the loss of nature from its current state, reducing future negative impacts, and focusing on restoration and renewal efforts. The Company is similarly committed to net zero deforestation in its supply chain.
In 2022, Ecopetrol signed the “COP15 Business Statement for Mandatory Assessment and Disclosure” promoted by Business for Nature, a global coalition that seeks to unite companies and conservation organizations towards a single purpose.
Furthermore, the commitment adopted in 2021 with the 1.t.org initiative of the World Economic Forum to protect 30,000 hectares of strategic ecosystems, planting 12 million trees, and capture at least two (2) million tonCO2e by 2030 continues to stand strong, with the first progress report sent in 2022.

In 2022, Ecopetrol signed the COP15 Business Statement for Mandatory Assessment and Disclosure promoted by Business for Nature, a global coalition that seeks to unite companies and conservation organizations towards a single purpose.
How is the Material
Element Managed?
In the environmental strategy, this pillar is structured based on four (4) lines of action:
It is governed, among others, by the guiding principles of prevention, precaution, and no net loss.
In terms of the mitigation hierarchy, its purpose is to prevent, avoid, mitigate, and offset potential residual impacts.
Nature-based solutions such as eco-reserves, natural climate solutions projects, and restoration and conservation actions, seek to generate positive impacts together with local communities and respond to the social and environmental challenges of climate change, water security, disaster risks, and loss of biodiversity.
How is the Material
Element Evaluated?
The roadmap established for this material element defines short, medium, and long term goals, indicators, and milestones. Depending on their relevance, some milestones are included in the TBG.
With regard to mandatory investments, specific indicators are defined as part of the 1% compensation and investment plans approved by the environmental authority to measure the impact on connectivity and on the species in the work areas. In the case of voluntary initiatives (TNC, WCS, Fondo Acción, Fundación Natura, and Catarruben), the carbon sequestration and social co-benefits of the projects are similarly measured.
As for impacts, indicators such as intervened hectares, volume of forest use, impact on species in the IUCN’s red list, and spills mainly affecting flora and fauna are also monitored.
In 2022, 1,309 biodiversity monitoring activities were conducted and the SIB-GIF registered a total of 199,987,209,642 biological records.
Short, Medium, and
Long-term Goals and Projects
| Goals | |||
|---|---|---|---|
| Milestone | Goal by 2023 | Goal by 2025 | Goal by 2030 |
| Accumulated trees supported, planted, and/or delivered | 6 million | 8 million | 12 million |
| Accumulated Ecoreserves | 20 eco-reserves | 25 eco-reserves | 50 eco-reserves |
| Hectares preserved and/or in restoration process | 20,000 ha | 25,000 ha | 30,000 ha |
| Clearance of accumulated MtCO2 with Natural Climate Solutions projects | 0.019 MtCO2 | – | 2-4 MtCO2 |
Preserve 15 wild species in 3 landscapes
Main Achievements in Managing the Biodiversity
and Ecosystem Services Roadmap
Six (6) SNC projects with TNC, WCS, Fondo Acción, F. Natura, Cataruben, and Conexión Jaguar (ISA), with
the potential of clearing
0.9 MtCO2e by 2025.
Distinction by Pacto Global Red Colombiana as one of the companies making the greatest contribution to the SDGs.
6,509,818 trees planted/delivered between 2018 and 2022.
239 families benefited from volunteer projects.
Second company with the largest number of biological records published in the SIB.
194 regionalized biomodels.
500 registrations for the diploma course in bioeconomy.
10 prioritized SBNs and 50 success stories on the SBN platform.
A guide to Sustainable Use endorsed by MADS.
Catalog of microorganisms (genomics) with the potential of being used in the bioremediation of hydrocarbons.
A digital application for the community monitoring of mangroves.
A high-tech mobile laboratory to study ecosystems at the country level.
One of the most advanced networks in Eddie-Covariance and ambient technologies.
Ecoreserves
The Ecopetrol Group created the Network of Ecoreserves, which are “geographically delimited areas, owned by Ecopetrol Group companies, which are voluntarily allocated in part or completely to the conservation of biodiversity and the offer of ecosystem services, without limiting their productive and exploratory vocation.” The Network currently consists of 15 Ecoreserves, with an approximate area of 15,085 hectares.
Of the first 15 Ecoreserves allocated until 2021, six (6) of them, amounting to 11,935 hectares, have Biodiversity and Reinforcement Plans, prepared together with the Humboldt Institute by means of the FIBRAS Agreement, and the implementation of the proposed activities are set to be launched by prioritizing the protection of identified Values Subject to Conservation (VOC).
Ecoreserves are voluntary private initiatives, which are expected to encourage other sectors of the economy to participate in this type of area-based conservation mechanisms as part of the environmental strategy to improve connectivity, biodiversity, and ecosystem services in general.


Socioecological Resilience
An innovative tool (conceptual model and web application) was developed together with the Humboldt Institute (FIBRAS Agreement) to better understand socio-ecological resilience in Ecopetrol’s areas of operation, by using a dynamic model that simulates the operation of the system against different impacts generated by productive activities in the territory, based on which a trend can be established over time. The tool will produce indicators to understand the limits of intervention in the territories without altering their balance.
It integrates eight (8) modules that gather the socioenvironmental components present in the environment: coverage, water, abiotic variables, habitat availability, diversity and redundancy, socioenvironmental conflicts, diversity of productive activities, and health. The modules are conceptualizations represented in differential equations (mathematical model) to simulate the operation of the system and model the trend of the properties that generate resilience against the potential impacts that may occur over time.
The input information for the model is taken from environmental impact assessments (EIA), environmental compliance reports (ICA), monitoring reports, and others.
The tool consists of two components:
1) A set of web services that receives the input data and emits the output data.
2) A simulator that contains a mathematical model organized into modules that generates time series for the variables associated with resilience based on some input data.
The implementation of a case study is currently underway using the LEAP methodology (Locate, Evaluate, Advise, Prepare), articulated with the TNFD pilot and its process for evaluating nature-related risks and opportunities.
For more information on the measures adopted in 2022 associated with genomics, biomonitors, and biomodels, visit the Environmental/Biodiversity section on the Ecopetrol website.

The Sustainable Use Guide for biotic compensation and the 1% investment was published together with TNC, with the endorsement of the Ministry of Environment and Sustainable Development.

Training, Capacity building, and Knowledge Workshops
The “Conservation, Biodiversity Management, and Sustainable Bioeconomy” diploma course began with 500 participants, thanks to the joint efforts between Ecopetrol, Pontificia Universidad Javeriana, and the Humboldt Institute. The objective of the course is to provide conceptual and practical tools to strengthen process optimization skills in organizations and boost the country’s transition towards sustainability, as well as position biodiversity and its ecosystem services as an economic alternative.
Training opportunities: diploma course titled Nature-Based Solutions as a tool for the comprehensive management of the territory and a series of webinars titled Coffee for the Territories on the topic labeled as “Let’s talk about conservation and the tools for territorial management.”
The Sustainable Orinoquía Pact, that Ecopetrol is part of, consolidates a joint vision and effort between the environmental sector and the main productive sectors in the region, in relation to common interests that favor the balance between productive use and the conservation of ecosystem services.
The Sustainable Use Guide for biotic compensation and the 1% investment was published together with TNC, with the endorsement of the Ministry of Environment and Sustainable Development. The Nature-Based Solutions Platform was also designed and published, with step-by-step indications on the management of 10 prioritized SBNs.
(GRI 304-2, 11-4-3) (WEF 9)
Nature of Significant Direct and
Indirect Impacts on Biodiversity
Hydrocarbon activity in Colombia takes place based on an environmental zoning process under the mitigation hierarchy, in order to avoid, minimize, and correct impacts on biodiversity, and offset residuals, in accordance with the current regulatory framework.
The main impacts are:
The construction or use of manufacturing plants, mines, and transportation infrastructure.
479.16 m3 of forests used for timber extraction, with exploitation permits from the environmental authority.
Contamination generated by operating incidents greater than one barrel, affecting fauna and flora species, and therefore activating appropriate response, treatment, and cleaning protocols.
The extent of the impacted areas is 7.55 ha.
(GRI 304-2, 11-4-3) (WEF 9)
Significant Direct and Indirect Positive
and Negative Impacts on Biodiversity
Positivos
In complying with the obligations of environmental compensation and investments of no less than 1% for the use of water from natural sources, the purpose is to preserve biodiversity and its ecosystem services in biodiversity hubs, with the signing of voluntary conservation agreements and the acquisition of land for conservation and ecosystem restoration objectives.
A total of 7.55 ha were intervened, as well as the forestry use of 479.16 m3 for timber extraction (equivalent to 14.19% of the volume of an Olympic swimming pool), mostly from isolated trees.
469 voluntary conservation agreements were managed to comply with environmental obligations in 5,094.7 ha. The sustainability of these actions will generate positive impacts on local and regional biodiversity and improve the productive practices of the communities involved.
198 feasibility diagnoses were conducted in the planning of projects and operations; 21 environmental assessments for exploration and production projects, including the biotic characterization of the areas of influence; 109 environmental management records associated with the preservation of the vegetation cover and the protection of biodiversity; and 71 plots of flowering trees monitored.
129 records of epiphytic flora samples taken, as well as 239 fauna samples and 577 hydrobiological sampling points.
Negative
The recovery plan for the Lisama 158 incident in 2018 records a progress of 93.7%, with the rehabilitation of 103 ha of vegetation cover still pending. The maintenance, follow-up, and monitoring of the rehabilitation is set to be completed by December 2025, for ANLA to close and verify the work done.
Land use change is one of the impacts caused by the Company’s projects and operations.
There were three (3) operating incidents greater than one barrel, with a total 64 barrels spilled, affecting bodies of water and/or vegetation. In all cases, the emergencies were addressed in accordance with the provisions set forth in the Emergency and Contingency Plans, with the proper cleaning of the bodies of water and the remediation of flora and fauna. The affected fish species were: two (2) Vulnerable (VU) species and 23 Minor Concern (LC) species, according to the current classification of the IUCN Red List.
(SASB EM-EP-140a.1) (SFC XVI) (TCFD M-1.1)
| Proven and probable reserves associated with protected areas for the preservation of biodiversity | Unit of measurement | 2022 |
|---|---|---|
| Number of proven reserves in protected areas for conservation or in habitats for endangered species | # | 4,857 |
| Total proven reserves | # | 1,680,555 |
| Percentage of net proven reserves in protected areas for conservation or in habitats for endangered species | % | 0.289 |
| Number of probable reserves in protected areas for conservation or in habitats for endangered species | # | 3,132 |
| Total probable reserves | # | 425,682 |
| Percentage of net proven reserves in protected areas for conservation or in habitats for endangered species | % | 0.736 |

Measures Adopted
to Manage Impacts
In the planning of projects and operations in the territory, Ecopetrol implements the mitigation hierarchy to avoid, minimize, recover, restore, or offset residual impacts on biodiversity, in accordance with Colombian legislation. The environmental license for hydrocarbon activities identifies areas of biological importance and conducts an environmental zoning process to exclude the ones with important environmental attributes from the operation.
To avoid impacts on biodiversity, most of Ecopetrol’s actions are executed in transformed areas. The impacts are minimized and recovered via the actions defined in the management instructions. Finally, the residual impacts are offset with the implementation of the current biotic compensation manual. All of the above, accompanied by monitoring programs proposed and validated by the competent environmental authorities.
The main lines of action for mandatory environmental compensation include: signing conservation agreements, purchasing land in strategic areas for conservation, protective reforestation and restoration according to the National Restoration Plan.

Mitigation Hierarchy
The measures adopted through the flora and fauna management instructions under the environmental instruments include, among others, the management of soils and vegetation cover, flora and stripping, the protection and conservation of habitats, strategic ecosystems, and protected areas, revegetation and/or reforestation, the management of water and hydrobiological resources, and flora conservation and compensation.
The environmental viability diagnosis guideline was updated in 2022 to incorporate the evaluation of impacts associated with strategic pillars in the early stage of the projects based on the mitigation hierarchy, incorporating early prevention and minimization measures against potential environmental impacts and risks.
Nature-Based Solutions
(SbN, as per its Spanish acronym)
Ongoing projects and initiatives:
- Wildlife Project (PVS) – Magdalena Medio, Orinoquía, and Putumayo: initiative with Wildlife Conservation Society – WCS and the Environment and Children’s Action Fund. PVS seeks to face the challenge of conservation of 15 threatened wild species, with the goal of preserving diversity and generating benefits for human communities.
- Magdalena Medio Wetlands CO2 Project: initiative with Fundación Natura to conserve and restore tropical forest ecosystems and freshwater wetlands, formulating and implementing actions to mitigate GHG generated by the degradation of these ecosystems.
- Conservation and Connectivity of the Forests and Wetlands of DRMI Ciénagas de Barbacoas: this is an ISA initiative under its Conexión Jaguar Program that strives for the conservation and connectivity of the Forests and Wetlands in this area.
- Carbon monitoring protocol – The Nature Conservancy (TNC): planting of 250,000 native trees in the departments of Meta and Caquetá. Strategy to monitor the plant material seeded to estimate the carbon absorption associated with the restoration process.
- Orinoco – Carbono del Orinoco CO2 Agreement: initiative with Cataruben to prevent the transformation, deforestation, and degradation of ecosystems and the generation of GHG emissions in the Orinoquía highlands.
- Ecopetrol Framework Agreement – Action Fund: seeks to strengthen the project management process in SNCs in the national territory, with a focus on green and blue carbon.
- FIBRAS Essence and Territory Agreement with the Alexander Von Humboldt Institute (IAvH): strives for the planning and management of biodiversity under sustainable development criteria, as well as its contributions to well-being. Components: Ecoreserves, Resilience, Monitoring, use of Biodiversity, and generation of Knowledge.
- Ecoreserves Agreement: with IAvH, CENIT, Oleoducto Bicentenario, and Ecopetrol to structure the management instruments for four (4) ecoreserves and analyze new opportunities.
- Study of carbon sinks with the Colombian Petroleum Institute (ICP): development of products and technology solutions to enhance carbon capture and ecosystem services attributable to Natural Climate Solutions.
Monitoring the Effectiveness
of the Measures Adopted
To monitor the effectiveness of the measures adopted in the different approaches to biodiversity management, periodic evaluations are conducted on the progress of each of the ongoing initiatives. The Company has internal management boards for the monthly report of the main milestones and success factors associated with each of the strategic areas in the biodiversity pillar.
To assess the effectiveness of the environmental compensation plans and compliance with other environmental obligations, follow-up indicators are implemented and reported on the Environmental Compliance Reports (ICAs) and evaluated by the environmental authorities.
Strategic partnerships are examined on a monthly basis, in order to identify technical and financial advances, in addition to detecting possible risks in execution. Furthermore, a report on the main achievements of each project will be prepared at the end of the year and published on the Ecopetrol website.
Lessons Learned and Incorporation
into the Company’s Operating Policies and Procedures
Ecopetrol has identified an operating risk concerning inadequate climate change and water management. Accordingly, the implementation of Nature-Based solutions (NbS) and projects was determined as a mitigation measure to ensure availability of resources and compliance with the goal of reducing GHG emissions in the medium and long term.
In 2022, the Company strived to incorporate the standardization of the resumes of the indicators into the operating policies and procedures, both for voluntary and mandatory actions.
On the other hand, two (2) work days were allocated to partners to share the lessons learned from the activities conducted in each project. Similarly, the Company participated in the construction of the methodological framework for the identification of risks and opportunities by the TNFD. In this sense, the construction of a resilience tool was furthered and a consultancy process for the management of natural capital was initiated. The Company also worked with 1t.org to define the first progress report.
Finally, progress was made in the management of knowledge and the reinforcement of a culture of biodiversity through the different strategic partnerships. Nine (9) biodiversity monitoring booklets were produced, including genomics expeditions and others, with more than 209,642 records in the GBIF and SIB, which have been used in 168 scientific articles. 500 people are taking a free virtual diploma course on bioeconomy and two (2) new books on biodiversity have been published.

How are Stakeholders Involved in Taking
Action to Manage Biodiversity?
Since 2019, a programmatic agreement has been promoted with MADS, in order to strengthen the country’s sustainable development on issues such as climate change, water resources, circular economy, and biodiversity. This agreement is in the process of being endorsed. Also, collaboration agreements have been established with national environmental institutes and systems to leverage their management around this material element.
Members of the surrounding communities are usually involved in the projects undertaken on the matter of biodiversity, thereby generating social and economic benefits without them being directly related to the traditional activities of the oil industry.
With the Employees Stakeholder Group, we have sought to strengthen the culture of biodiversity using effective training tools to raise awareness in them and generate greater knowledge about the relevance of the issue in the Company’s activities.
In terms of the supply chain, a first proposal for a green clause on the use of legal timber was produced in 2022, in alignment with the “Intersectoral Agreement for Legal Timber in Colombia,” which is under evaluation for its effective incorporation into the contracts.
(GRI 304-1,11-4-2) (WEF 9)
Operation Centers Located Within
or Next to Protected Areas, or Areas of High
Biodiversity Value Outside of Protected Areas
For 2022, Ecopetrol does not report any operations in protected areas categories I to IV according to the IUCN.
| Indicate the following information regarding protected or restored areas in the habitats (Voluntary) | |||||
|---|---|---|---|---|---|
| Criterion | Unit of measurement | 2019 | 2020 | 2021 | 2022 |
| Trees planted or contributed to communities, environmental authorities, or local governments | # | 138,620 | 462,449 | 367,276 | 367,215 |
| Nurseries established | # | 8 | 22 | 22 | 29 |
| Seedlings produced in nurseries | # | 9,000 | 90,724 | 92,868 | 116,039 |
| Areas planted or undergoing restoration | ha | 3,976 | 3,201 | 2,772 | 35 |
| Number of protected water sources | # | NA | NA | NA | 26 |
| Conservation agreements signed | # | 60 | 23 | 21 | 156 |
| Hectares managed in conservation agreements | ha | 14,127 | 14,048 | 314 | 17,879 |
| Area in silvopastoral systems | ha | NA | NA | NA | NA |
| Area in agroforestry systems | ha | NA | NA | NA | NA |
| Eco-efficient kitchens established | # | NA | NA | NA | NA |
| Protected areas declared under any conservation classification | # | 15 | 15 | 15 | 16 |
| Protected hectares declared under any conservation classification | ha | 17,675 | 17,675 | 17,675 | 17,720 |
| Green homes | # | NA | NA | NA | NA |
| Photovoltaic systems | # | NA | NA | NA | 5 |
| Apiaries – Meliponaries | # | NA | NA | NA | NA |
| Hydrographic subzones intervened | # | NA | NA | NA | 16 |
| Km of bodies of water protected | km | NA | NA | NA | 65 |
| New or reinforced hydrometeorological stations | # | NA | NA | NA | NA |
| Threatened wild species under conservation | # | 15 | 15 | 15 | 15 |
| Number of Ecoreserves | # | 2 | 6 | 15 | 15 |
| Hectares of the Ecoreserves Network | ha | 414 | 11,906 | 15,085 | 15,085 |
| Trees planted or contributed to communities, environmental authorities, or local governments | # | 442,350 | 220,605 | 67,470 | 248,377 |
| Nurseries established | # | NA | NA | 2 | 3 |
| Seedlings produced in nurseries | # | NA | NA | 21,122 | 39,442 |
| Areas planted or undergoing restoration | ha | NA | 5,438 | 5,549 | 230,2 |
| Number of protected water sources | # | 2 | 92 | NA | 89 |
| Conservation agreements signed | # | NA | 29 | 161 | 469 |
| Hectares managed in conservation agreements | ha | NA | 2,045 | 2,297 | 5,094.7 |
| Area in silvopastoral systems | ha | 100 | NA | 34 | 37.8 |
| Area in agroforestry systems | ha | 181 | 204 | 22 | 71.73 |
| Eco-efficient kitchens established | # | 72 | NA | 5 | 55 |
| Protected areas declared under any conservation classification | # | NA | NA | NA | NA |
| Protected hectares declared under any conservation classification | ha | NA | NA | NA | NA |
| Green homes | # | NA | NA | NA | NA |
| Photovoltaic systems | # | 20 | NA | NA | 5 |
| Apiaries – Meliponaries | # | NA | NA | NA | NA |
| Hydrographic subzones intervened | # | 5 | 2 | 7 | 16 |
| Km of bodies of water protected | km | 10 | 22 | 31 | 26 |
| New or reinforced hydrometeorological stations | # | NA | NA | NA | 0 |
| Threatened wild species under conservation | # | NA | NA | NA | NA |
| Number of Ecoreserves | # | NA | NA | NA | NA |
| Hectares of the Ecoreserves Network | ha | NA | NA | NA | NA |
| Trees planted or contributed to communities, environmental authorities, or local governments | # | 580,970 | 682,054 | 434,746 | 615,592 |
| Nurseries established | # | 8 | 22 | 24 | 32 |
| Seedlings produced in nurseries | # | 9,000 | 90,724 | 113,990 | 155,481 |
| Areas planted or undergoing restoration | ha | 3,976 | 8,640 | 8,321 | 265.2 |
| Number of protected water sources | # | 2 | 92 | 0 | 115 |
| Conservation agreements signed | # | 60 | 52 | 182 | 625 |
| Hectares managed in conservation agreements | ha | 14,128 | 16,093 | 2,611 | 22,973.7 |
| Area in silvopastoral systems | ha | 100 | NA | 34 | 37,8 |
| Area in agroforestry systems | ha | 181 | 204 | 22 | 71,73 |
| Eco-efficient kitchens established | # | 72 | NA | 5 | 55 |
| Protected areas declared under any conservation classification | # | 15 | 15 | 15 | 16 |
| Protected hectaresdeclared under any conservation classification | ha | 17,675 | 17,675 | 17,675 | 17,720 |
| Green homes | # | NA | NA | 0 | 0 |
| Photovoltaic systems | # | 20 | NA | 0 | 10 |
| Apiaries – Meliponaries | # | NA | NA | 0 | 0 |
| Hydrographic subzones intervened | # | 5 | 2 | 7 | 32 |
| Kilometers of bodies of water protected | km | 10 | 22 | 31 | 91 |
| New or reinforced hydrometeorological stations | # | NA | NA | 0 | 1 |
| Threatened wild species under conservation | # | 15 | 15 | 15 | 15 |
| Number of Ecoreserves | # | 2 | 6 | 15 | 15 |
| Hectares of the Ecoreserves Network | ha | 414 | 11,906 | 15,085 | 15,085 |
Note: The data reported in table 65 correspond to execution figures closed for the year; the areas with conservation, restoration, and protection actions are still in process. For the GRI 304-3 indicator, only criteria whose unit of measurement is in areas (ha) are taken into consideration.
Tree planting by the Ecopetrol Group is framed within the designation of the decade of restoration (2021-2030) declared by the United Nations, which is carried out through: Planting of native species in compliance with environmental obligations and with voluntary resources from the businesses, generation of alliances with Corporations, Mayors’ Offices, Governors’ Offices, and communities, for the planting of native trees in strategic areas and/or delivering trees that come from nurseries that Ecopetrol GE has directly or in alliances with NGOs, Corporations, Mayors’ Offices, Governors’ Offices, and communities.
The methodologies implemented for conservation and restoration actions depend on the type of action and are based on official documents such as the National Restoration Plan, technical guides from the Ministry of Environment, TNC, WCS, Alexander von Humboldt Institute, IUCN, technical specifications from ANLA and regional and local environmental authorities, among others.
The areas protected or restored by Ecopetrol are located in the national territory in the areas of operational and project influence.

In compliance with environmental compensation and the 1% investment obligations, 687 ha were conserved in 2022, restoration models were implemented in 317 ha, and reforestation models in 185 ha.
| Species | Unit of measurement | 2021 | 2022 |
|---|---|---|---|
| Critical danger | # | 1 | 0 |
| Danger | # | 1 | 0 |
| Vulnerable | # | 2 | 2 |
| Near threatened | # | 2 | 0 |
| Minor concern | # | 1 | 23 |
De las especies reportadas, en total son 25:
Two (2) are vulnerable species (VU), five (5) fauna individuals of the palm bear (Myrmecophaga tridactyla) and zocay monkey (Plecturocebus ornatus) species.
23 are of minor concern (LC).
60 fauna individuals.
32 flora individuals.
Roadmap
Circular Economy
Notable
material element
| Impacted Stakeholder Groups | Areas managing the impacts | Ecopetrol business line or segments generating the highest impact |
|---|---|---|
| Suppliers | The entire Company | Upstream |
| Associates and Partners | Midstream | |
| Customers | Downstream | |
| Employees | Commercial | |
| Investors | ||
| State | ||
| Society and Community |
Why is the Element Material?
GHG emissions, including methane, and their effect on the rise of global temperature, are considered a negative impact due to the changes produced in long-term weather conditions, reflected in the occurrence of extreme weather events (floods and droughts) that mainly affect the most vulnerable populations. On the other hand, the impacts on the use and exploitation of water resources may be related to the effect on the water supply of the basin and the discharges could change the quality of surface and underground water bodies. All this can affect fundamental rights such as a healthy environment, access to water, and personal safety
and development.
The operations undertaken by the Company in the production, transport, refining, and trading of hydrocarbons and their derivatives have an impact on climate change or on the consumption and quality of water.
The circular economy is a cross-cutting enabler that contributes to the goals of energy transition, net zero carbon emissions, reducing the water footprint, closing the materials and waste cycle, and managing natural capital. This element generates opportunities for growth, innovation, job creation, and the conservation of biodiversity and ecosystem services.
Considering the above and its importance for the Stakeholder Groups, the circular economy is therefore a notable element for the Ecopetrol Group.
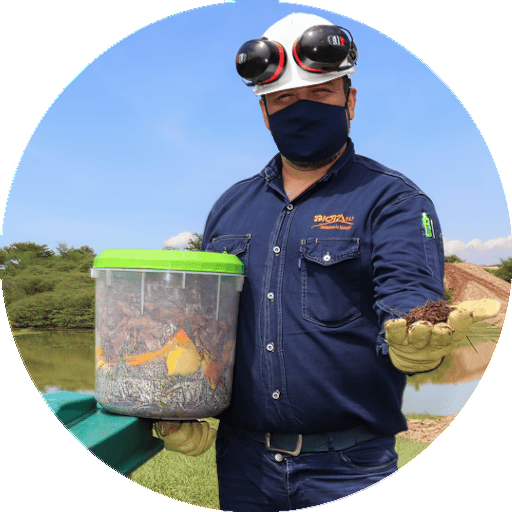
The implementation of the circular economy model allows the Company to:
1
Promote efficiency in the use of materials, water, energy, and the recovery capacity of ecosystems.
2
Enhance the identification of initiatives for the development of new business models with economic, environmental, and social benefits.
3
Boost innovation, technology, and research in new products and services.
The circular economy, as a cross-cutting enabler, can have real and potential impacts, as well as negative and positive effects:
Real positive impacts:
- Generation of knowledge for the creation of new business models in the products offered; for example, the application of asphalt mix with recycled plastic for the paving of roads.
- Advances in research: for example, using oily sludge residues as asphalt binders for low-traffic roads.
- Less use of natural fresh water, thanks to water reuse initiatives.
- Compliance with annual emission reduction goals.
- Generation of skills in the professionals of the Ecopetrol Group for the implementation of circular initiatives, through Universidad Corporativa’s skills program.
- Strengthening of productive systems (cocoa, coffee, dairy, poultry, etc.) by implementing circular strategies using by-products.
Potential positive impacts:
- Creation of new business models that contribute to the energy transition and industrial symbiosis, in order to calculate the triple impact benefits (social, environmental, and economic) of the initiatives implemented.
- To reach the water neutrality goal by 2045, Ecopetrol will reduce 66% of fresh water catchments for industrial use (compared to 2019), with zero industrial wastewater discharges into bodies of fresh water, and a 34% compensation of the remaining water consumed.
- Zero net emissions by 2050 and a 25% reduction by 2030 (Scopes 1 and 2).
- Higher levels of transparency, certified in best practices in circular economy.
Potential negative impacts:
- Materials listed internationally with future unavailability, affecting the TESG and operability goals defined by the Company.
- Disrupted logistics (delays in the transit of materials due to the closing of roads, ports, and airports, as well as freight increases, higher port congestion, fuel prices, customs procedures).
Policies and Commitments
Circular economy has been considered in the 2040 Strategy, under the Generating Value with TESG pillar, and also as a strategic pillar in the environmental strategy, which seeks to promote the best industry practices on this matter to ensure competitiveness and become a cross-cutting enabler for the goals set.

How is the Material
Element Managed?
The roadmap defined for this element contemplates five (5) lines of action:

01
Strengthening skills and generating knowledge: seeks to create the necessary skills and strengthen the culture to promote circular economy models for the Ecopetrol Group.
02
Circular initiatives bank: entails the identification and monitoring of the Ecopetrol Group’s circular initiatives.
03
Incorporation of circularity criteria in operating, financial, commercial, and supply procedures.
04
Circularity in the supply chain: the purpose is to promote circular initiatives in the procurement of goods and services and in the engagement with suppliers.
05
Circularity metrics: quantitative and qualitative parameters are developed in this field to measure the progress made with respect to the Ecopetrol Group’s circularity.
How is the Material Element Evaluated?
Short, medium, and long term goals, management indicators, and milestones are established as part of the roadmap. Depending on their relevance, some are included in the different instances defined by the HSE management system, such as: follow-up on the updating of the circular initiatives bank to monitor their progress and implementation in the different areas of the Company.
1
Calculation of social, environmental, and economic benefits of the circular initiatives implemented.
2
Measuring the participation of professionals in the courses related to the strengthening of skills.
3
Measurement of qualitative and quantitative circularity metrics to determine the Company’s level of maturity in this area. Monitoring is conducted on a monthly basis by the HSE Committees and the vice-presidencies of the different business segments
in the Ecopetrol Group.
Short, Medium, and
Long Term Goals and Projects
Short Term
Calculation of environmental, social, and economic benefits for 100% of the initiatives implemented.
Implementation of 100% of prioritized circular business cases and industrial symbiosis.
Implementation of qualitative and quantitative circular economy measurements.
Incorporation of circular criteria in operating, commercial, financial, and supply procedures.
Medium Term
Implementation of 100% of prioritized circular business cases and industrial symbiosis.
Strengthening of 100% of basic skills in the selected population.
Long Term
Implementation of 100% of prioritized circular business cases and industrial symbiosis.
Substitution of new raw materials by secondary or renewable ones.
Strengthening advanced skills in the selected population.
(GRI 3-3-e) (WEF 12E,13E)
Main Achievements in Managing
the Circular Economy Roadmap
4,194 Ecopetrol officials completed the basic circular economy course, 153 took the intermediate level, and 33 finished the advanced level.
There are 342 circular initiatives to date, 45% of them related to decarbonization, 32% to waste, 15% to water, 6% to materials, and 2% to biodiversity and energy efficiency. Progress has been made in their implementation, with 24% in execution, 18% in planning, 7% in research, 21% implemented, and 23% that continue in ideation.
Three (3) industrial symbiosis business opportunities were identified with the construction sector together with the ACP for the use of waste.
Seven (7) life cycle analyses between waste and products that will allow the identification of their impacts and the establishment of long-term environmental declarations on the product.
The Center of Excellence for Engagement between subsidiaries, business segments, and partners was inaugurated.
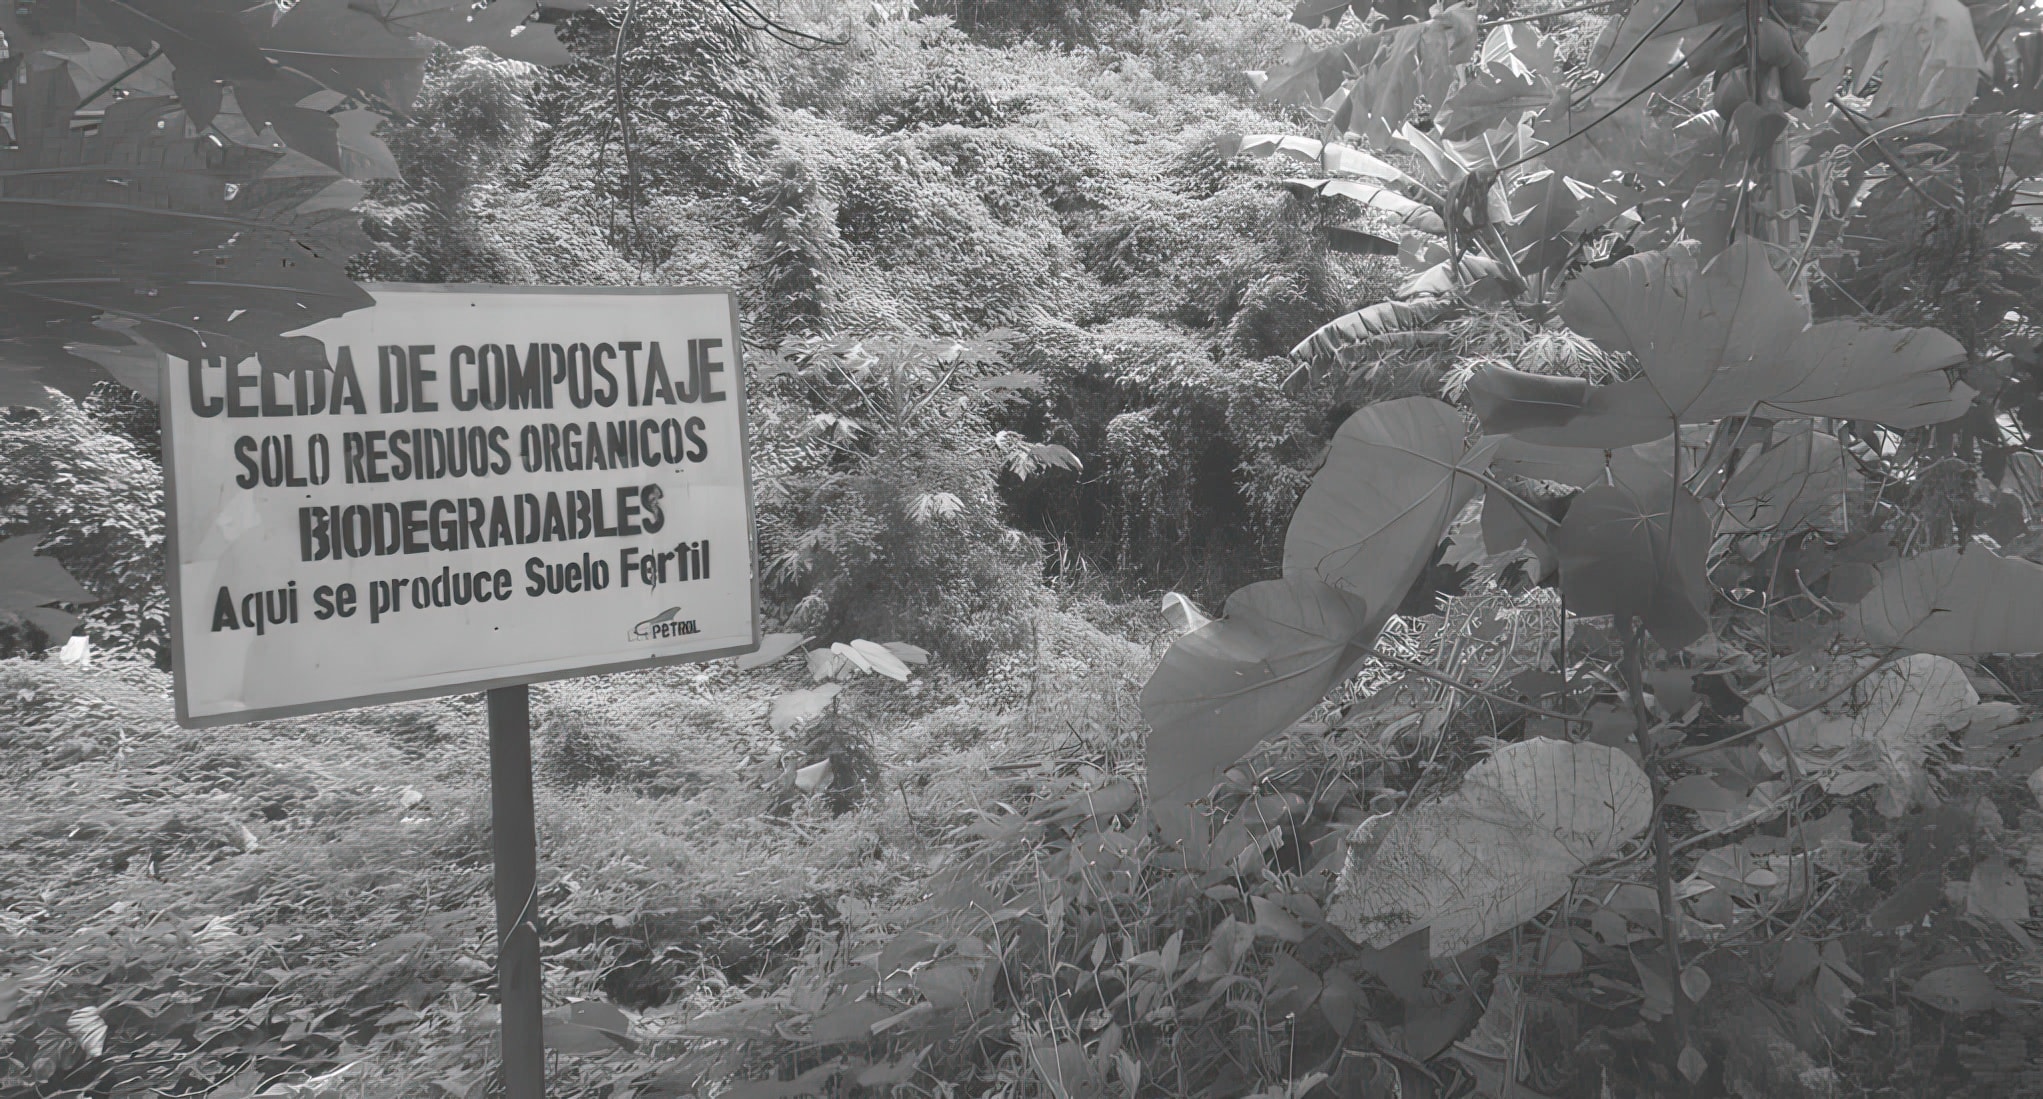
There are 342 circular initiatives to date, 45% of them related to decarbonization, 32% to waste, 15% to water, 6% to materials, and 2% to biodiversity and energy efficiency.
In 2022, we actively worked on the implementation of the Circular Economy
model among the different segments of the hydrocarbon business and subsidiaries.
For more information and metrics, visit the Circular Economy section on the website.
Vice Presidency of Development and Projects (EDP)
Achievements
- 75% of the projects in maturation define Increased Value Practices (PIV, as per its Spanish acronym) focused on the selection of technology and circular economy (a. Management of water resources; b. Alternatives for the replacement, reduction, and optimization of materials, tools, and equipment in the projects, c. Alternatives for the recirculation, reuse, and final disposal of solid waste).
- The “Sustainable Construction” Guide was applied for the environmental feasibility of using sustainable materials or waste management practices in ongoing projects.
- The circularity indicators or benefits related to the recirculation of water and reuse of rainwater were calculated, as well as the use of construction and demolition waste (RCD, as per its Spanish acronym), the use of water-based cuts, oil recycling or reuse, and the optimization of H-frame pipelines, among others.
- The circularity indicator “% of critical material” was calculated with baryte for 2022, which is a raw material used in the drilling of three (3) wells in the area of Piedemonte; the result (60.3%) indicates that it is a material used in significant quantities as a heavy material in heavy fluids. The strategy was defined within the projects for the mapping of possible risks in order to mitigate them, considering that baryte is listed internationally as a critical material.
Vice Presidency of Supply (VAB)
Achievements
- 34,176,254 kg of waste were appraised in the area, representing 47.6 BCOP in income, with 94% accounting for ferrous waste, which in turn was used in full, growing by 9% compared to 2021. 173,462 kg of ferrous waste were transformed into 348 racks and 8 cantilevers, with a 100% circularity indicator and generating avoided costs in the amount of 401 MCOP. 3.5 BCOP in avoided costs for standing waste sales. Through the process of repurchasing turbo machinery equipment with manufacturers, one (1) unit was sold for remanufacturing, generating income in the amount of 3 BCOP and extending the operating life thereof.
- 72% in the circularity indicator of food service materials, growing by 3% vs. 2021, with increased purchases of inputs carrying a green seal and composting with the waste generated in the food service.
- 76,829 tCO2e were reduced in the supply and services chain, with 56% corresponding to mitigation levers managed with partners such as energy efficiency, incorporation of low-emission vehicles in the operation, and circular initiatives. The remaining 44% corresponded to the compensation of emissions through the acquisition of carbon credits by the partners, mainly in projects associated with Natural Climate Solutions that provide social benefits for the country.
Vice Presidency of Production - VDP
Achievements
- 13 circular initiatives were prioritized, associated with the use of materials, emission reduction, energy generation, and water reuse.
- Entry into operation of the drinking water treatment plant in the La Colorada river in Magdalena Medio, where the sludge generated in said plant can be used in the construction or road sector, and the positive pronouncement by ANLA on the use of vegetable oil in nine (9) sections of roads in the fields of the Piedemonte Vice Presidency.
Vice Presidency of Refining – VRP (includes REFICAR)
Achievements
Approval by the MADS to conduct the following technological tests:
- Use the oily sludge from the Barrancabermeja refinery as a by-product in the bottoms unit at the Cartagena refinery (to promote the development of industrial symbiosis projects between the two refineries in which the RESPELs (Waste and Hazardous Waste Generator Register) resulting from a production process can be considered by-products and used to replace a raw material in another production process if certain conditions and environmental criteria are met).
- Recovery of metals from spent catalysts that are of interest to other production chains.
- Regeneration of spent catalysts to recover their catalytic capacity and be used again in the original process.
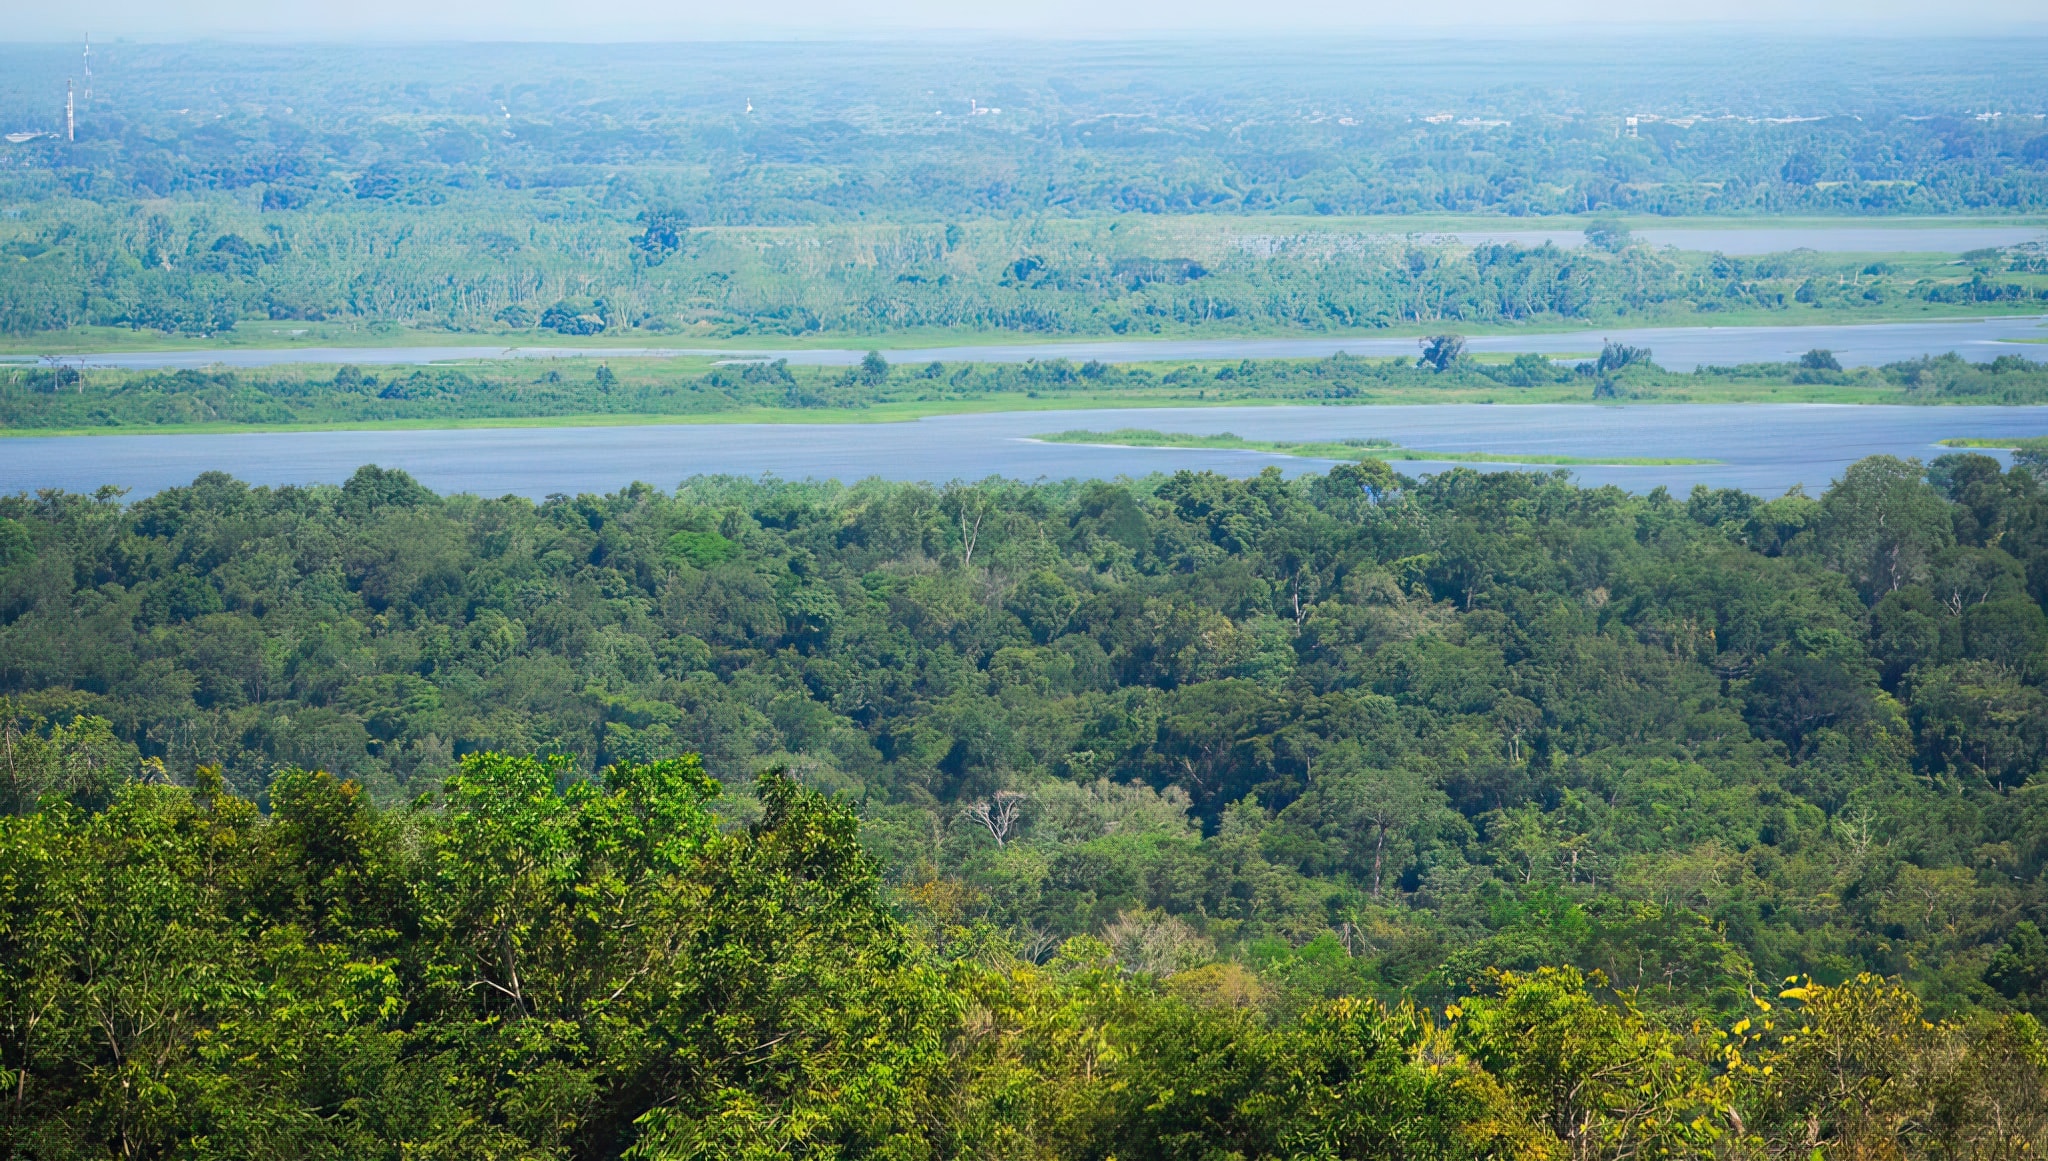
Circular Economy outlook and main results for the Ecopetrol Group (Cenit/ISA/Esenttia/Hocol)
| SUBSIDIARY | Outlook | Materials and Waste | Water | Energy/Decarbonization |
|---|---|---|---|---|
| CENIT | Design and development of the TESG Stations Program |
|
|
|
| ISA | Encourage the implementation of systems that contribute to continuous improvement, promote eco-efficiency and the sustainable use of ecosystem services and natural resources, enhance the positive effects and ensure compliance with environmental performance objectives and goals. |
|
|
|
| ESENTTIA | Role models and mobilizers in the formulation and implementation of a Circular Economy model in the Plastic industry in Latin America. |
|
| |
| HOCOL | Circular Economy as an enabler to leverage the ambition of net zero carbon emissions; the energy transition; efficient and sustainable management of materials, water, and energy; responsible return and synergies that contribute to closing the materials and waste cycle. |
|
|
|
Asphalt modified with recycled plastic
In 2022, the Ecopetrol Group was the pioneer in Colombia in the application of this type of asphalt, which is more environmentally-friendly and meets the INVIAS regulation.
Objective:
- Commoditize its use in the roads around the country.
- More sustainable products.
- Incorporation of circular economy processes that ensure an efficient and responsible use of our resources.
Benefits:
- Less plastic being discharged into water sources and landfills.
- Strengthening of the collection chain and the work of recyclers by promoting plastic waste as a product that generates value.
- Replaces part of the imported polymers used for the modification of asphalt.
First Application in El Dorado - Bogota
A section of 0.5 km was paved with type III modified asphalt near el Dorado, which required the use of 125.000 plastic bags.
| Leader of the Initiative | Ecopetrol – VCM – GPP |
|---|---|
| Concessionaire | OPAIN |
| Builder | Dromos |
| Asphalt supplier | Ecopetrol |
| Modified asphalt producer | MPI – Manufacturas y procesos industriales |
| Recycled plastic supplier | Reciclene – Plastilene |
| Length | Total 500mt, divided into five 100-meter sections each |
| Period of execution | Oct 9-12/22 |
| Status of execution and asphalt quality | Successful |
| Follow-up | Monthly – Opain |
| Length – width – thickness | 500 mt – 3,5 mt – 0,06 mt |
| Asphalt volume | 17 tons |
| Recycled plastic volume | 0.17 tons |
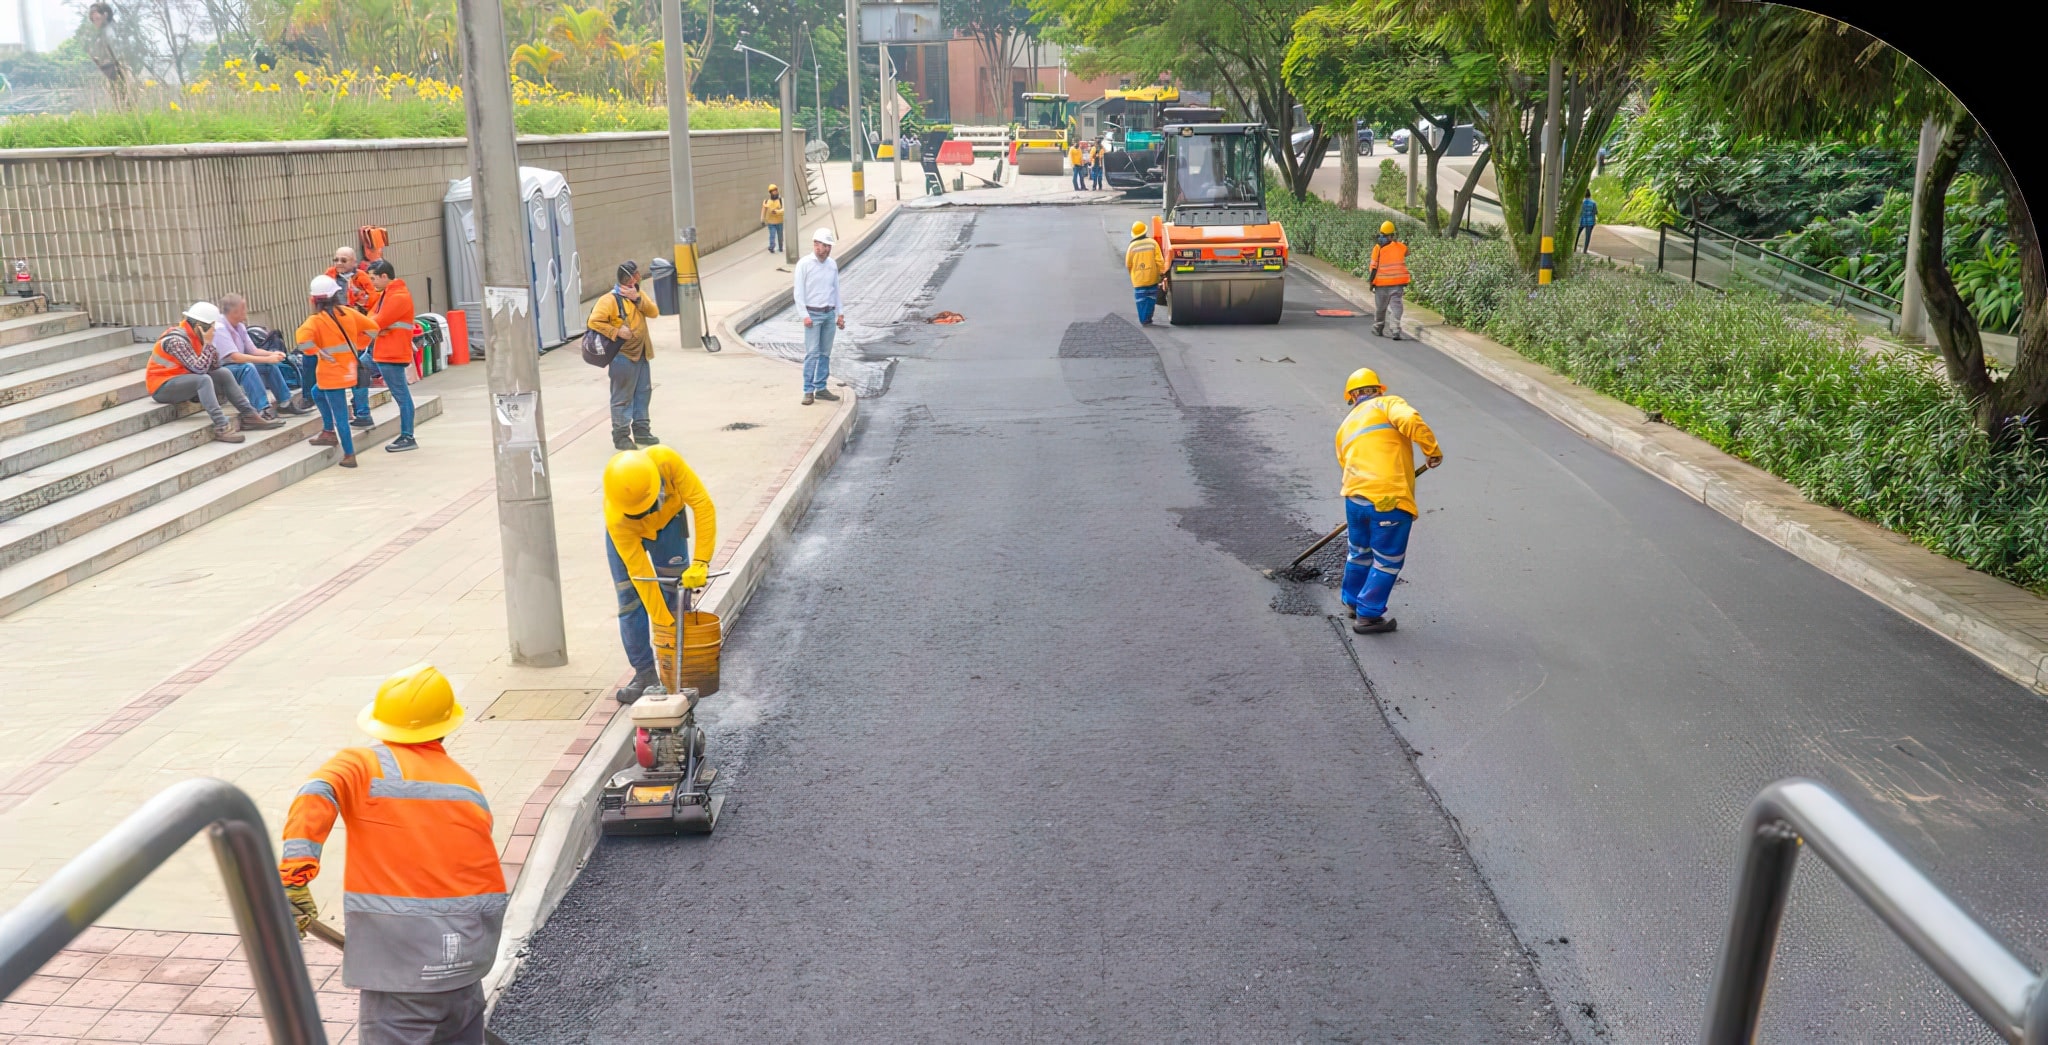
First Application in Medellín
A section of 0.5 km was paved with type III modified asphalt near el Dorado, which required the use of 125.000 plastic bags.
| Leader of the Initiative | Ecopetrol – VCM – GPP |
|---|---|
| Contracting party | Medellín City Hall |
| Builder | Pavimentar |
| Asphalt supplier | Ecopetrol |
| Modified asphalt producer | HQ – Humberto Quintero y Cía. |
| Recycled plastic supplier | Esenttia |
| Length | 220 mt wide, 8mt wide, 0,6 mt thick |
| Period of execution | Nov 19, 20, 21/22 |
| Status of execution | |
| and asphalt quality | Successful |
| Follow-up | Monthly – Pavimentar |
| Asphalt volume | 34 tons |
| Recycled plastic volume | 0.5 tons |
Monitoring the Effectiveness of the Measures Adopted
Considering that the Circular Economy is an enabler for the fulfillment of the goals set for the energy transition, net zero carbon emissions, the reduction of the water footprint, the closing of the materials and waste cycle, and the management of natural capital, the effectiveness of the measures adopted is therefore reviewed in accordance with the material elements of climate change, integrated water management, and biodiversity, mainly, bearing in mind the short, medium, and long term objectives defined for this material element.
Lessons Learned and Incorporation into
the Company’s Operating Policies and Procedures
The national and international standards and norms issued by organizations such as the WBCDS, the Ellen MacArthur Foundation, GRI, Icontec, Sustainalytics, as well as the circularity best practices and trends in the sector, have allowed the organization to establish internal guidelines and procedures to advance in its level of circularity maturity, including the following:
Definition of 26 circular quantitative indicators, with results in water, materials, and criteria materials in the projects and supply areas.
Incorporation and application of circular criteria in operating procedures such as:
- Guidelines on sustainable ecodesign in engineering projects.
- Inclusion of circularity in environmental feasibility diagnoses, comprehensive development plans, and social investment procedures.
Implementation of viewers to monitor ongoing circular initiatives.
Development of a basic, intermediate, and advanced training program.
Creation of the center of excellence in this subject matter for joint work with subsidiaries, business segments, and partners.
How are Stakeholders Involved
in Taking Action to Manage the Circular Economy?
Ecopetrol actively participates with different organizations at the national and international level for the Company to learn and adopt the best practices available for the implementation of circular businesses and strategies. In 2022, the Company actively worked with ACP, IPIECA, Icontec, Invias, and universities including Industrial de Santander and Los Andes, in the execution of agreements, projects, or regulatory processes.
In addition to the above, Ecopetrol workers and affiliates are provided with training tools through the Ecopetrol University to strengthen skills in this area and facilitate the implementation of circular economy principles.
With regard to local communities, Ecopetrol participated in the Protegiendo mi Planeta program, training girls and boys in responsible consumption practices on the Providencia Island, and in the “She is a virtual astronaut” program deployed by Fundación She Is. In this sense, the work carried out with players in sustainable agribusiness projects is also worth highlighting, which seeks to define strategies and intervention components to implement circularity-related solutions that reduce the impact on the ecosystems.
As for national entities, the MADS has been established since 2019 and there is also a sectoral agreement that prioritizes this issue, which in the process of endorsement to be aligned with the National Development Plan (2022-2026).
Last but not least, supply chain guidelines and best practices are defined with suppliers, recognized in innovative products or services and outstanding sustainable practices.

Level of Circularity Maturity
By means of the Circularity Metrics line of action in the Roadmap, Ecopetrol seeks to periodically assess the level of progress using qualitative and quantitative metrics, as described below, together with the standards defined by the Company to begin measuring gradually and progressively as of 2021.
The second measurement was taken in 2022, following the methodology proposed since its first year of implementation, with the participation of 170 people in level 1[27] and 43 people in level 2[28] , showing a 37% and 43% increase, respectively, compared to 2021.
The defined measurement approaches are as follows:
Qualitative: to internally establish the circularity maturity level in an organization, by examining how the principles of circular economy (systemic thinking, innovation, responsible management, collaboration, value optimization, and transparency) are being implemented with current decisions and activities. This measurement is taken using the GTC 314:2020 standard launched by ICONTEC in November 2020.
Semi-qualitative-quantitative: external measurement that reports information in a standardized manner and with a score that shows the progress made, to understand where the Company is in the transition towards a circular economy compared with other companies. The tool selected for this purpose is Circulitys developed by the Ellen MacArthur Foundation, a pioneer in Circular Economy.
Quantitative: framework of indicators based on an evaluation of material flows, with other indicators on the efficiency and effectiveness of the resources, the economic investment, and the technological incorporation in circular initiatives. Mix of indicators according to different standards (e.g., WBCSD, Ellen MacArthur Foundation, ISO 59020 or others).
The GTC is a renowned guide nationwide, structured in November 2020 as a self-assessment tool for organizations to determine their internal level of circularity maturity by reviewing how the principles (systemic thinking, innovation, responsible management, collaboration, value optimization, and transparency) are implemented through current decisions and activities. This level of maturity is described in five (5) levels, from zero to four: immature, basic, in the process of improvement, committed, and optimal.
(GRI 305-1, 305-2, 305-3, 11-1-5, 11-1-6, 11-1-7) (WEF 7,7E) (TCFD M1.2.1)
| Year | 2019 | 2020 | 2021 | 2022 |
|---|---|---|---|---|
| Level of maturity | – | – | 3 | 3 |
During the second qualitative measurement, Ecopetrol maintained its rating at level 3, showing that it is a Company committed to circularity.
This means that it is advancing towards a more circular and sustainable mode of operation by implementing the principles of the circular economy with the following results:

01
The notion of Systemic thinking has been grasped and actions that drive innovation and technology have been maintained.
02
Evidence shows awareness of responsible management beyond legal compliance and collaborative work.
03
Value optimization and perception of transparency were reinforced throughout the year.
04
Targeted actions deployed to promote innovation and technology.
05
Awareness of responsible management beyond legal compliance.
Based on this measurement, a work plan is then structured to close gaps with the operating and support areas.
In 2022, Ecopetrol defined the focus of the questions regarding its level of circularity maturity, according to Circulytics, and its ability to address the corresponding requirements to take the first measurement in 2024.
Roadmap
Use of energy
and alternative sources
Notable
material element
| Impacted stakeholder groups: | Areas that manage the impacts: | Ecopetrol business line or segments generating the highest impact: |
|---|---|---|
| Investors | VSE | Upstream |
| Associates and Partners | VIJ | Midstream |
| State | VDS | Downstream |
| Society and Community | VNE | Low emission solutions |
| Suppliers | VTI | |
| VHSE | ||
| VPU | ||
| VCF | ||
| VRP | ||
| VAB |
Why is the Element Material?
Ecopetrol’s operations have the potential of generating GHG emissions, criteria pollutants, and volatile organic compounds, especially in the upstream and downstream, which can affect air quality. They can similarly affect the availability and quality of water, due to catchments and discharges into water sources.
The identification of low emission solutions and the consolidation of mitigation programs in the Company’s direct operation helps mitigate the effects of climate change, generates positive economic impacts (employment generation, construction of energy communities) and process efficiencies, and reduces GHG emissions.
Managing these impacts can affect or enhance the right to a healthy environment, development, access to water and personal safety, among others.
The efficient use of energy and the incorporation of alternative sources is part of the strategy adopted by Ecopetrol and its Group in the context of Energy Transition, which includes short, medium, and long-term goals towards energy efficiency and the incorporation of non-conventional renewable energy sources (FNCER) and hydrogen, in pursuit of reaching the carbon neutrality goal by 2050.
Policies and Commitments
In terms of self-generation of non-conventional renewable energy, the aspiration is that between 30% and 40% of own energy consumption comes from green sources. By 2022, Ecopetrol attained a capacity of 208 MW between solar and wind energy, which paves the road for the goal of 900 MW by 2025 (solar, wind, biomass, and geothermal), all for self-consumption purposes.
Moreover, the roadmap for the production of at least 1 million tons of low-carbon hydrogen (H2) by 2040 was launched in 2022. The first goal by 2030 is to produce white H2 for own consumption and for export.
How is the Material
Element Managed?
The Energy Efficiency Program has optimized the energy performance of the assets, with a methodology supported by the ISO 50001 standard, focusing on the following actions:
- i) Operational control.
- ii) Technological improvement.
- iii) Integration into Ecopetrol’s processes.

- Operational initiatives: arising from the analysis of the processes, based on the construction of baselines, goals, and the identification of operating control recommendations and the incorporation of best practices to maintain optimal energy performance. These initiatives are executed daily in the operating areas and require minimal or no investment.
- Technological improvement initiatives: these require capex and consist of the identification and replacement of obsolete, low-efficiency, or oversized equipment.
- Renewable Projects: a robust portfolio is available with several alternatives to secure the goal of MW installed and the reduction of emissions in order to mitigate potential negative impacts.
In terms of non-conventional renewable energy, Ecopetrol has set a goal of incorporating 400 MW of renewable energy into its supply matrix by 2023, using solar, wind, and geothermal technologies, and a maturing portfolio of other technologies such as biomass and small hydroelectric plants. By doing so, attention will be placed on the demand for electrical energy from its operations and the requirements for the incorporation of the low-emissions H2 Strategic Plan. This, in pursuit of sustainable growth and the decarbonization of part of the traditional business, as well as the development of new business lines and new low-carbon markets.
How is the Material Element Evaluated?
There are five (5) key indicators:
1
Optimization of energy demand:
The optimized electrical energy is calculated with the energy demand baseline of the initiatives that report benefits year by year, and it is compared with the annual energy demand to obtain the percentage of optimization achieved.
2
CO2 emissions reduction:
Tons of CO2 not emitted thanks to demand optimization.
3
Cost optimization:
Quantification of costs associated with the optimization of energy demand, according to the rate of the energy products consumed.
4
Incorporation of renewable energies:
The MW of installed capacity in operation and under construction are quantified at the end of each year to ensure compliance with the goal.
5
Integration of technology capacity in electrolyzers:
The MW of installed capacity in electrolyzers for the dissociation of the water molecule are quantified, and with them, the production of green hydrogen through FNCERs (Non-conventional renewable energy sources).
Short, Medium, and Long Term Goals and Projects
01
The energy efficiency goals are proposed as follows:
- 3% in the period of 2018 – 2022
- 6% in the period of 2023 – 2028
- 10% in the period of 2026-2040
02
Incorporate 400 MW of energy from Non-Conventional Renewable Energy Sources by 2023 and 900 MW by 2025.
03
Produce 1 Mton of H2/year by 2040, of which 40% will be Green H2, 30% White H2, and 30% Blue H2.
Main Achievements in Managing
the Roadmap on the Use of Alternative Energies and Source
To see the results of this roadmap, refer to the Business line/Low emission solutions/ Performance section of this Report.
Monitoring the Effectiveness
of the Measures Adopted
The energy efficiency program defines goals associated with the initiatives under development in each of the upstream, midstream, and downstream segments, in terms of energy demand optimization and emissions reduction, which are monitored on a monthly basis, and the percentage of optimized demand is calculated at the end of each year with respect to the average total energy demand for the year.
In terms of renewable energy, systematic monitoring is conducted on all initiatives included in the portfolio, and they are evaluated using an indicator tied to the incorporation of renewable energies, in order to generate early warnings and structure action plans for the execution of each of the projects.
Lessons learned and incorporation into the Company’s operating policies and procedures.
Given the growing relevance of this element in the advancement of the 2040 Strategy, a more robust investment portfolio was structured in 2022, with monthly monitoring of capex execution.
Additionally, the element of energy management was incorporated into Ecopetrol’s comprehensive policy, and the elements required for its evolution are being included in alignment with existing processes at Ecopetrol.
How are Stakeholders Involved in Taking Action to manage the use of alternative energy and sources?
To develop renewable energy initiatives, Ecopetrol interacts with its different stakeholder groups through its project development, supply, and new business processes to maximize the value of their relationship.
Similarly, to comply with the energy efficiency plan, the main stakeholder group is made up of the teams working in the operating areas, as internal customers, by implementing operating control on the processes and developing investment initiatives (technological improvement).
These actions also contribute greatly to the benefit of other Stakeholder Groups, such as society and the community, which are positively impacted by the use of other energies, whose effects are different from those originating from conventional sources.
(GRI 302-1,11-1-2) (TCFD M-1.1)
Consumption and Energy Intensity
| Consumption of fuels from renewable or non-renewable sources within the organization | Unit of measurement | 2019 | 2020 | 2021 | 2022 |
|---|---|---|---|---|---|
| Total consumption of fuels from renewable sources in GWh | GWh | 88.2 | 65.4 | 54.6 | 168.7 |
| Total consumption of fuels from non-renewable sources in GWh | GWh | 3,297 | 3,030 | 2,813 | 2,752.08 |
| Total | GWh | 3,385.2 | 3,095.4 | 2,867.6 | 2,920.78 |
(GRI 302-1,11-1-2) (TCFD M-1.1)
| Energy consumption of the different types of energy purchased, excluding steam | Unit of measurement | 2021 | 2022 |
|---|---|---|---|
| Electricity consumption | GWh | 2,309.84 | 2,881.13 |
| Heating consumption | GWh | – | – |
| Cooling consumption | GWh | – | – |
| Total | GWh | 2,309.84 | 2,881.13 |
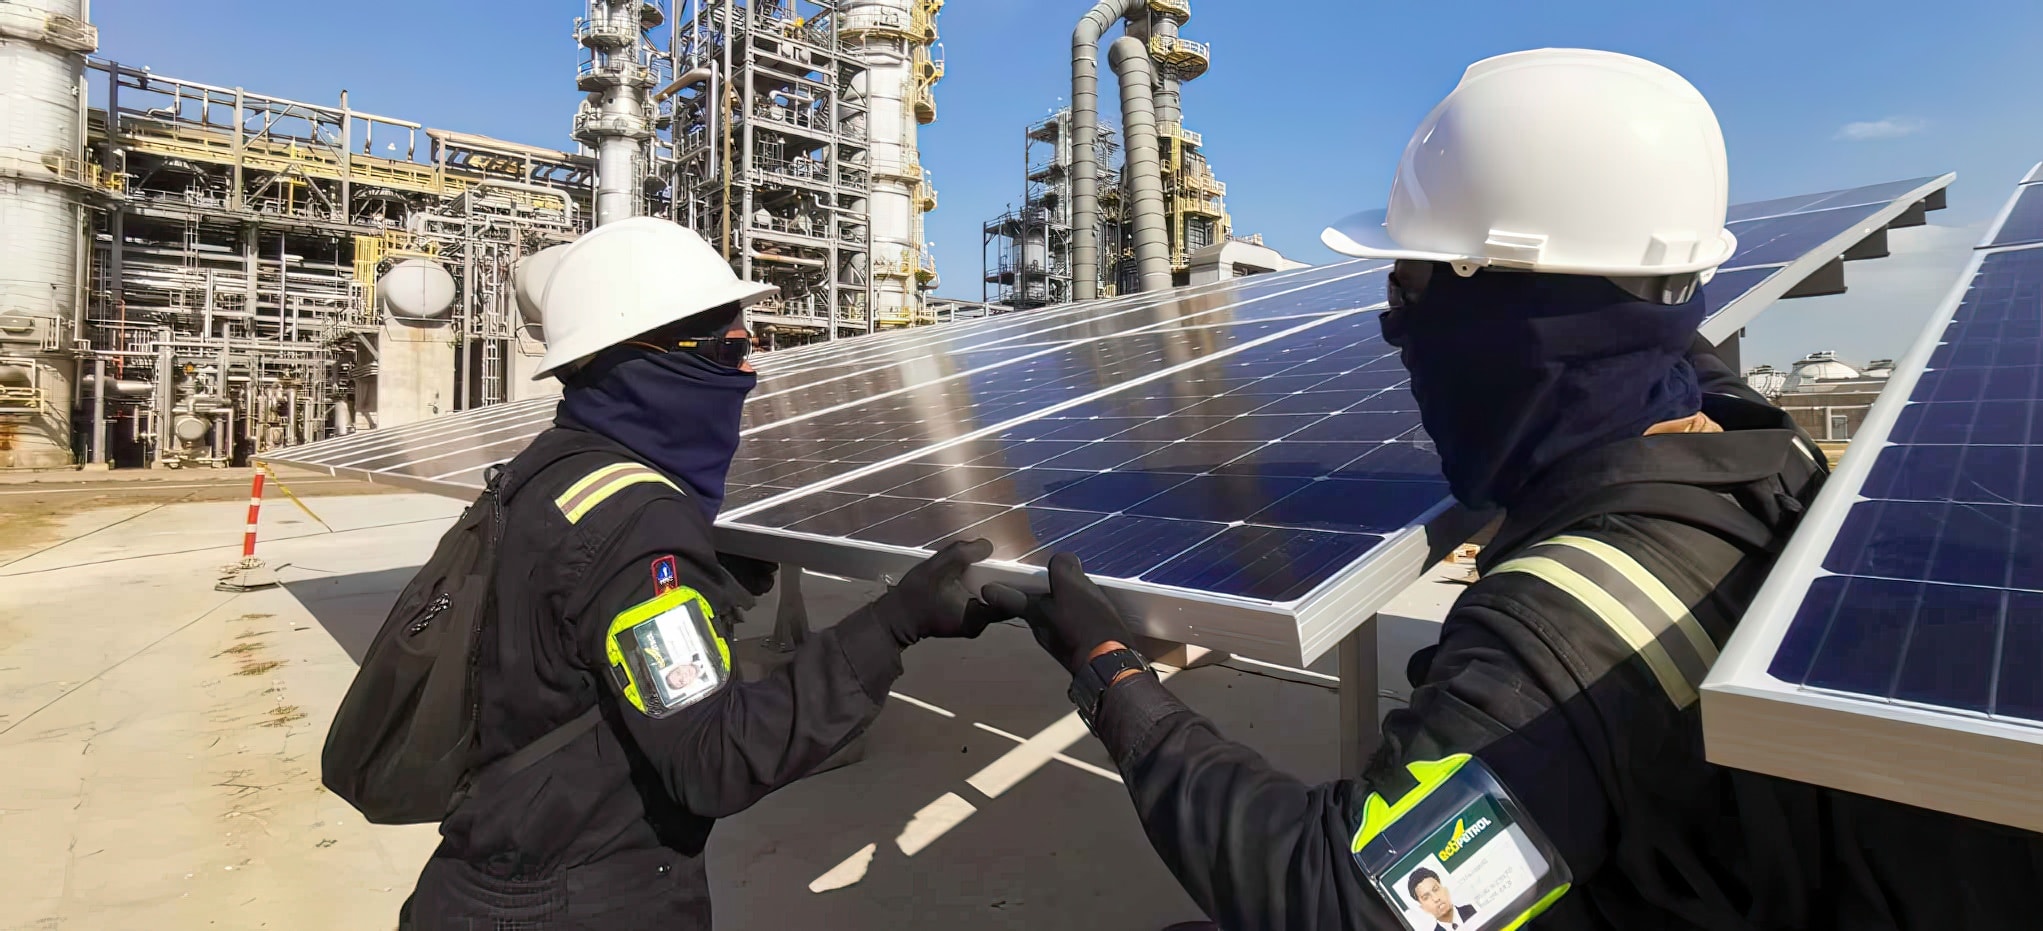
(GRI 302-1,11-1-2) (TCFD M-1.1)
| Energy consumption of the different types of self-generated energy, excluding steam | Unit of measurement | 2021 | 2022 |
|---|---|---|---|
| Self-generated electricity | GWh | 1,515 | 1,517.5 |
| Self-generated heating | GWh | – | – |
| Self-generated cooling | GWh | – | – |
| Total | GWh | 1,515 | 1,517.5 |
(GRI 302-1,11-1-2) (TCFD M-1.1)
| Energy consumption of the different types of energy sold, excluding steam | Unit of measurement | 2021 | 2022 |
|---|---|---|---|
| Electricity sold | GWh | 81.58 | – |
| Heating sold | GWh | – | – |
| Cooling sold | GWh | – | – |
| Total | GWh | 81.58 | 0 |
(GRI 302-1,11-1-2) (TCFD M-1.1, M-1.2.2)
| Steam self-generated and sold | Unit of measurement | 2019 | 2020 | 2021 | 2022 |
|---|---|---|---|---|---|
| Self-generated steam | klb | 27,026,294 | 23,962,888 | 22,276,124 | 25,618,267 |
| Steam sold | klb | 17,520 | 17,520 | 17,520 | 17,520 |
(GRI 302-1,11-1-2) (TCFD M-1.1, M-1.2.2)
| Total energy consumption within the organization | Unit of measurement | 2021 | 2022 |
|---|---|---|---|
| Total energy consumption within the organization | GWh | 6,610.86 | 7,319.58 |
| Total steam energy consumption in klb | klb | 22,258,604 | 25,600,747 |
| Total energy consumption outside the organization | Unit of measurement | 2021 | 2022 |
|---|---|---|---|
| Energy consumption used outside the company | GWh | NA | NA |
| Energy consumption used outside the company in Klb | klb | NA | NA |
Note: By regulatory provision, Ecopetrol does not sell energy to third parties. All energy consumption is used up within the Company.
(GRI 302-3, 11-1-4) (TCFD M-1.1)
| Energy intensity ratio | Unit of measurement | 2021 | 2022 |
|---|---|---|---|
| Energy consumption | KWh | 4,498,319,441 | 4,936,462,840 |
| Barrels produced | Bbls | 4,230,032,541 | 4,488,565,767 |
| Energy intensity ratio | kWh/bbl | 1.063 | 1.100 |
(GRI 302-3, 11-1-4) (TCFD M-1.1)
The type of energy included in the intensity ratio is electricity.
The total non-renewable energy consumption goal for 2022 was 7,590,605 MWh. Ecopetrol’s effective management allowed its operations to meet the goal, in accordance with the defined range and also below it.
(GRI 302-4, 11-1-2, 302-1, 302-3, 302-4) (TCFD M-1.1, M-1.2.2)
Reduced Energy Consumption as a Direct
Result of Conservation and Efficiency Initiatives
The type of energy included in the conservation and efficiency initiatives is electricity. The methods used for the calculation are indicated below:
1
Savings from operational control: savings are calculated according to the ISO50001 standard, establishing energy management indicators with respect to energy consumption baselines.
2
Savings from technological improvements:
- Establishing theoretical savings: assumes a fixed percentage value in savings from a base consumption, experimental results, and simulations.
- Calculation of periodic savings: a base consumption is defined (through measurements or simulations) and the actual energy consumed is measured at periodic intervals; this difference is established as the savings that will be updated at the established frequency.
- Savings according to ISO5001: energy management savings and indicators are calculated with respect to energy consumption baselines.
3
Roadmap
Fuel Quality
Notable
material element
| Impacted Stakeholder Groups | Areas that manage the impacts: | Ecopetrol business line or segments generating the highest impact |
|---|---|---|
| Society and Community | VCM | Midstream |
| State | VDS | Downstream |
| Customers | VHSE | Commercial |
| Investors | VRP | |
| VTI |
Why is the Element Material?
Ecopetrol’s operations, especially those handling hydrocarbon combustion and storage processes, hydrocarbon separation from water during treatment, and eventually any system with potential fugitive emissions, have the potential of generating criteria pollutant emissions (particulate matter, carbon monoxide, sulfur and nitrogen oxides) and volatile organic compounds -VOCs, which can affect air quality and consequently, people’s right to health, to a healthy environment, and to water, among other rights.
Guaranteeing the quality of fuels within regulated specifications ensures a continuous improvement of air quality and the control of CO2 emissions and other contaminants, so as to not impact the health and the continuous, sustainable, profitable, and clean operation of the refineries; as well as ensure the achievement of the refining margins expected by the Shareholders and the provision of resources for growth investments and technological updates.
Also, guaranteeing the country’s energy security and sovereignty with the fuel supply from the refineries ensures the stability of the Colombian market and expands the energy supply for mobility, making room for modern technologies that increase efficiency, reduce emissions, and diversify the Colombian automotive park.
The energy transition and the movements associated with climate change represented at COP 26 and COP 27 have deepened the trend towards a greater use of renewable energy sources and alternative fuels. This phenomenon is generating changes in the context of the Company, including new fuel quality requirements and broader mandates pertaining to the reduction of emissions and environmental regulations.
Ecopetrol’s commitment to deliver cleaner fuels every day precedes this growing interest from its different Stakeholder Groups and is part of its strategic vision. For this reason, the management of fuel quality improvement and assurance was identified as a notable element in the 2020 materiality exercise.
Policies and Commitments
Ecopetrol is aligned with the country’s position and its adherence to the air quality commitments at COP 26 and COP27; also, at the regional level, the Company has adhered to the commitments set in the air quality pacts with the environmental secretariats of the main cities in the country.
Ecopetrol has defined a fuel quality path as a strategy to go beyond compliance with regulations and promote Ecopetrol’s commitment to the environment. This initiative is reinforced with the decarbonization of downstream operations, which is in line with the strategy to reduce GHG emissions associated with the Climate Change element.

How is the Material Element Managed?
Ecopetrol has adopted a quality improvement program for the fuels produced and a quality assurance plan for fuel production in its refineries. Both are aligned with current regulations and standards in Colombia, which is where these operations are located, and also with best international quality standards in North American countries and in the European Union.
The roadmap for this material element has determined that the Company’s long-term ambition is to become an international benchmark for the production of diesel, gasoline, and renewable fuels. To this end, Ecopetrol works in an agile and efficient manner in the following lines of action:

01
Gasoline quality.
02
Diesel quality.
03
Renewable fuels such as biodiesel (FAME), renewable diesel, renewable jet fuel. Process optimization and operational excellence.
Some of the measures adopted to manage the material element and its impacts are:
The management control structure in each refinery, including follow-up and control through quality committees, production committees, and management committees for accountability, performance monitoring, and results assurance and improvement.
Assuring the asset management process, including the sub-processes of incorporation, structured operation, maintenance, and asset optimization, with the application of its systematic practices (operating analysis, elimination of defects, improvement of plans, change control, maturation of initiatives).
Designing and implementing the fuel quality path and its updated route.
Executing quality plans by process and by product line.
Flexibility in the configuration of the refineries and the synergies between them so as to ensure compliance with supply and quality commitments with sufficient time in advance based on operational planning.
Investments and improvements in the procurement configuration of raw materials and fuel blending optimization.
Monitoring air quality by developing and systematically following-up on air quality measurement results using low-cost measuring equipment in Bogotá and Barrancabermeja.
The availability of robust contingency plans, designed and established to anticipate, prevent, and react with the necessary resources to address quality and supply risks.
Practicing dynamic and comprehensive risk management to secure processes and business continuity.
Training and developing the people involved in the processes to prepare them for proper decision making.
How is the Material Element Evaluated?
Short, Medium, and Long Term Goals and Projects
Gasolina y diésel (contenido de azufre):
Short term
2022
Gasoline with less than 50 ppm sulfur content is being delivered as of July 1, 2022.
2023
The refineries are ready to produce diesel with less than 15 ppm sulfur content and deliver it on the date required by Resolution 40103.
Medium term
2025
Produce diesel with less than 10 ppm sulfur content.
Long term
2030
Produce gasoline with less than 10 ppm sulfur content and an octane number greater than 88.
Biofuels:
Short term
2022
the industrial pilot for the production of renewable diesel by co-processing palm oil was deployed with the participation of Ecodiesel and the Cartagena refinery.
A study was conducted to use a section of the paraffin plant in the production of renewable jet fuel.
Medium term
2023-2025
Maturation of diesel and renewable jet fuel projects.
Long Term
2025
Continuous production of biofuels via co-processing or with dedicated plants.
2026
Expansion of Ecodiesel’s biodiesel production capacity.
Main Achievements in
Managing the Fuel Quality Roadmap
In 2022, Ecopetrol invested around 10 MUSD in different projects and initiatives to improve fuel quality at the Barrancabermeja refinery: (1) conceptual engineering of the project to guarantee compliance with Resolution 40103 in gasoline; (2) procurement and engineering of the HCM project to improve the cetane number in diesel.
Operational, maintenance, and logistics measures were adopted at Ecopetrol and by the agents in the chain for the production and delivery of regular gasoline with < of 50 ppm sulfur content. The annual average sulfur content in regular motor gasoline was 50.1 ppm (first semester specification < 100 ppm).
At the Cartagena refinery: development of the conceptual engineering for the U-107 Naphtha quality improvement project (investment close to 2 MUSD), which will adapt the infrastructure to produce gasoline with less than 10 ppm sulphur content.
Monitoring the Effectiveness
of the Measures Adopted
Se ha asegurado una alta efectividad de las medidas adoptadas mediante:

- Controlling and monitoring the quality results of the fuels delivered to the refineries.
- Verifying the execution of the necessary improvements plans applicable to structures, assets, standards, and technologies to ensure that the processes are up to date and meet the quality objectives.
- Verifying scenarios for the incorporation of lessons learned, which are rigorously developed to ensure that fuel quality is framed within the quality path defined by Ecopetrol.
- Monitoring and exerting quality control over the production, preparation, and release of the product, and also over measurement, transportation, storage, delivery, and distribution throughout the execution of the process.
- Verifying the specific value and average quality of the fuels produced and managed by the Ecopetrol Group, in compliance with specifications throughout the year.
Lessons Learned and Incorporation into the
Company’s Operating Policies and Procedures
Ecopetrol abides by certifications ISO 9000 and OSHA18000 ISO 14000; as such, it exerts control over the lessons learned throughout the PVHA cycle in the management of competencies, risks, processes, and continuous improvement to incorporate it into its management structure. This same management system is applied for the follow-up, control, monitoring, and implementation of the lessons learned from the material element.
Ecopetrol applies, leads, and participates in first, second, and third party audits at its refineries to secure its processes and practices.
Moreover, the Company monitors the quality of the fuels produced and delivered to customers from the refineries and the different stations and points of delivery to the wholesaler, guaranteeing compliance with the quality required under Colombian regulations.
Quality inspection laboratories are set up at Ecopetrol refineries, in the ICP, and at Cenit (in charge of transporting these fuels to Ecopetrol’s wholesale customers). These laboratories are accredited under the ISO 17025 standard and follow the standards and procedures defined in Resolution 40103 of April 2021 for diesel and gasoline fuels, and also provide support for jet fuels.
How are Stakeholders Involved in
Taking Action to Manage Fuel Quality?
At the local level, air quality agreements were reached with the State (Bogotá and Medellín). What is more, there is permanent interaction with the regulatory entity to monitor the quality of the operation and confirm the status of the production and supply chain.
With regard to customers, there is permanent communication with wholesalers, vehicle importers, and partner unions, under the guidelines of Resolution 40103, to address technical queries, needs, and/or improvements.
Employees actively participate in improvement initiatives, and also in the operation, maintenance, and optimization of the systems through the management structure, performance, and the improvement of skills. The investors approve the necessary improvement actions and investments to adhere to the fuel path and related plans and programs.
With suppliers and contractors, improvements have been defined in the catalysts, chemicals, and other raw materials used in the refining process to optimize the production and quality of the fuels and reduce the emissions generated. They also participate in the execution of projects to deliver better fuel quality.
Last but not least, the community participates through research and development and through air quality improvement programs in the universities. It is also a key player in verifying air quality improvements through the reports and accountability and public interactions with the Company.
| Fuel quality metrics | Unit of measurement | 2022 |
|---|---|---|
| Lead content | g/L | 0 |
| Premium benzene-gasoline content | %vol/Vol | 0.3 |
| Benzene content-regular gasoline | %vol/Vol | 0.62 |
| Sulfur content | ppm weight | 50.6* |
*Average values for the year before and after the new 50 ppm regulation came into force in July.
Note: The values listed in the table above correspond to the quality data for regular motor gasoline (weighted average between the 2 main Ecopetrol refineries – Barrancabermeja and Cartagena) as of December 31. It should
be noted that as of July 1, 2022, both refineries will consistently deliver Regular Gasoline with a sulfur content quality of less than 50 ppm (in the first half of 2022, the sulfur content specification for regular gasoline was < 100ppm).
Volume of Biofuels
Produced and Purchased
Below are the biofuel production and purchase volumes (B100 biodiesel and B2 diesel) in 2022:
| Biocombustibles | Unidad de medida | 2019 | 2020 | 2021 | 2022 |
|---|---|---|---|---|---|
| Volumen de B2 vendido | mbbls | 33,123 | 28,827 | 32,987 | 39,722 |
| Volumen de biocombustible comprado | mbbls | 762 | 563 | 639 | 835.1 |
Nota: El volumen de B2 vendido para 2022 tiene fecha de cierre a 31 de diciembre, y corresponde a la suma de los volúmenes vendidos en la refinería de Barrancabermeja y la refinería de Cartagena. El volumen de biocombustible comprado biodiésel para 2022 tiene fecha de cierre a 31 de diciembre, y corresponde a la suma de los volúmenes comprados en la refinería de Barrancabermeja y la de Cartagena.
Biodiesel plant with a 120 Kton-year capacity, located within the facilities of Ecopetrol’s Barrancabermeja refinery.
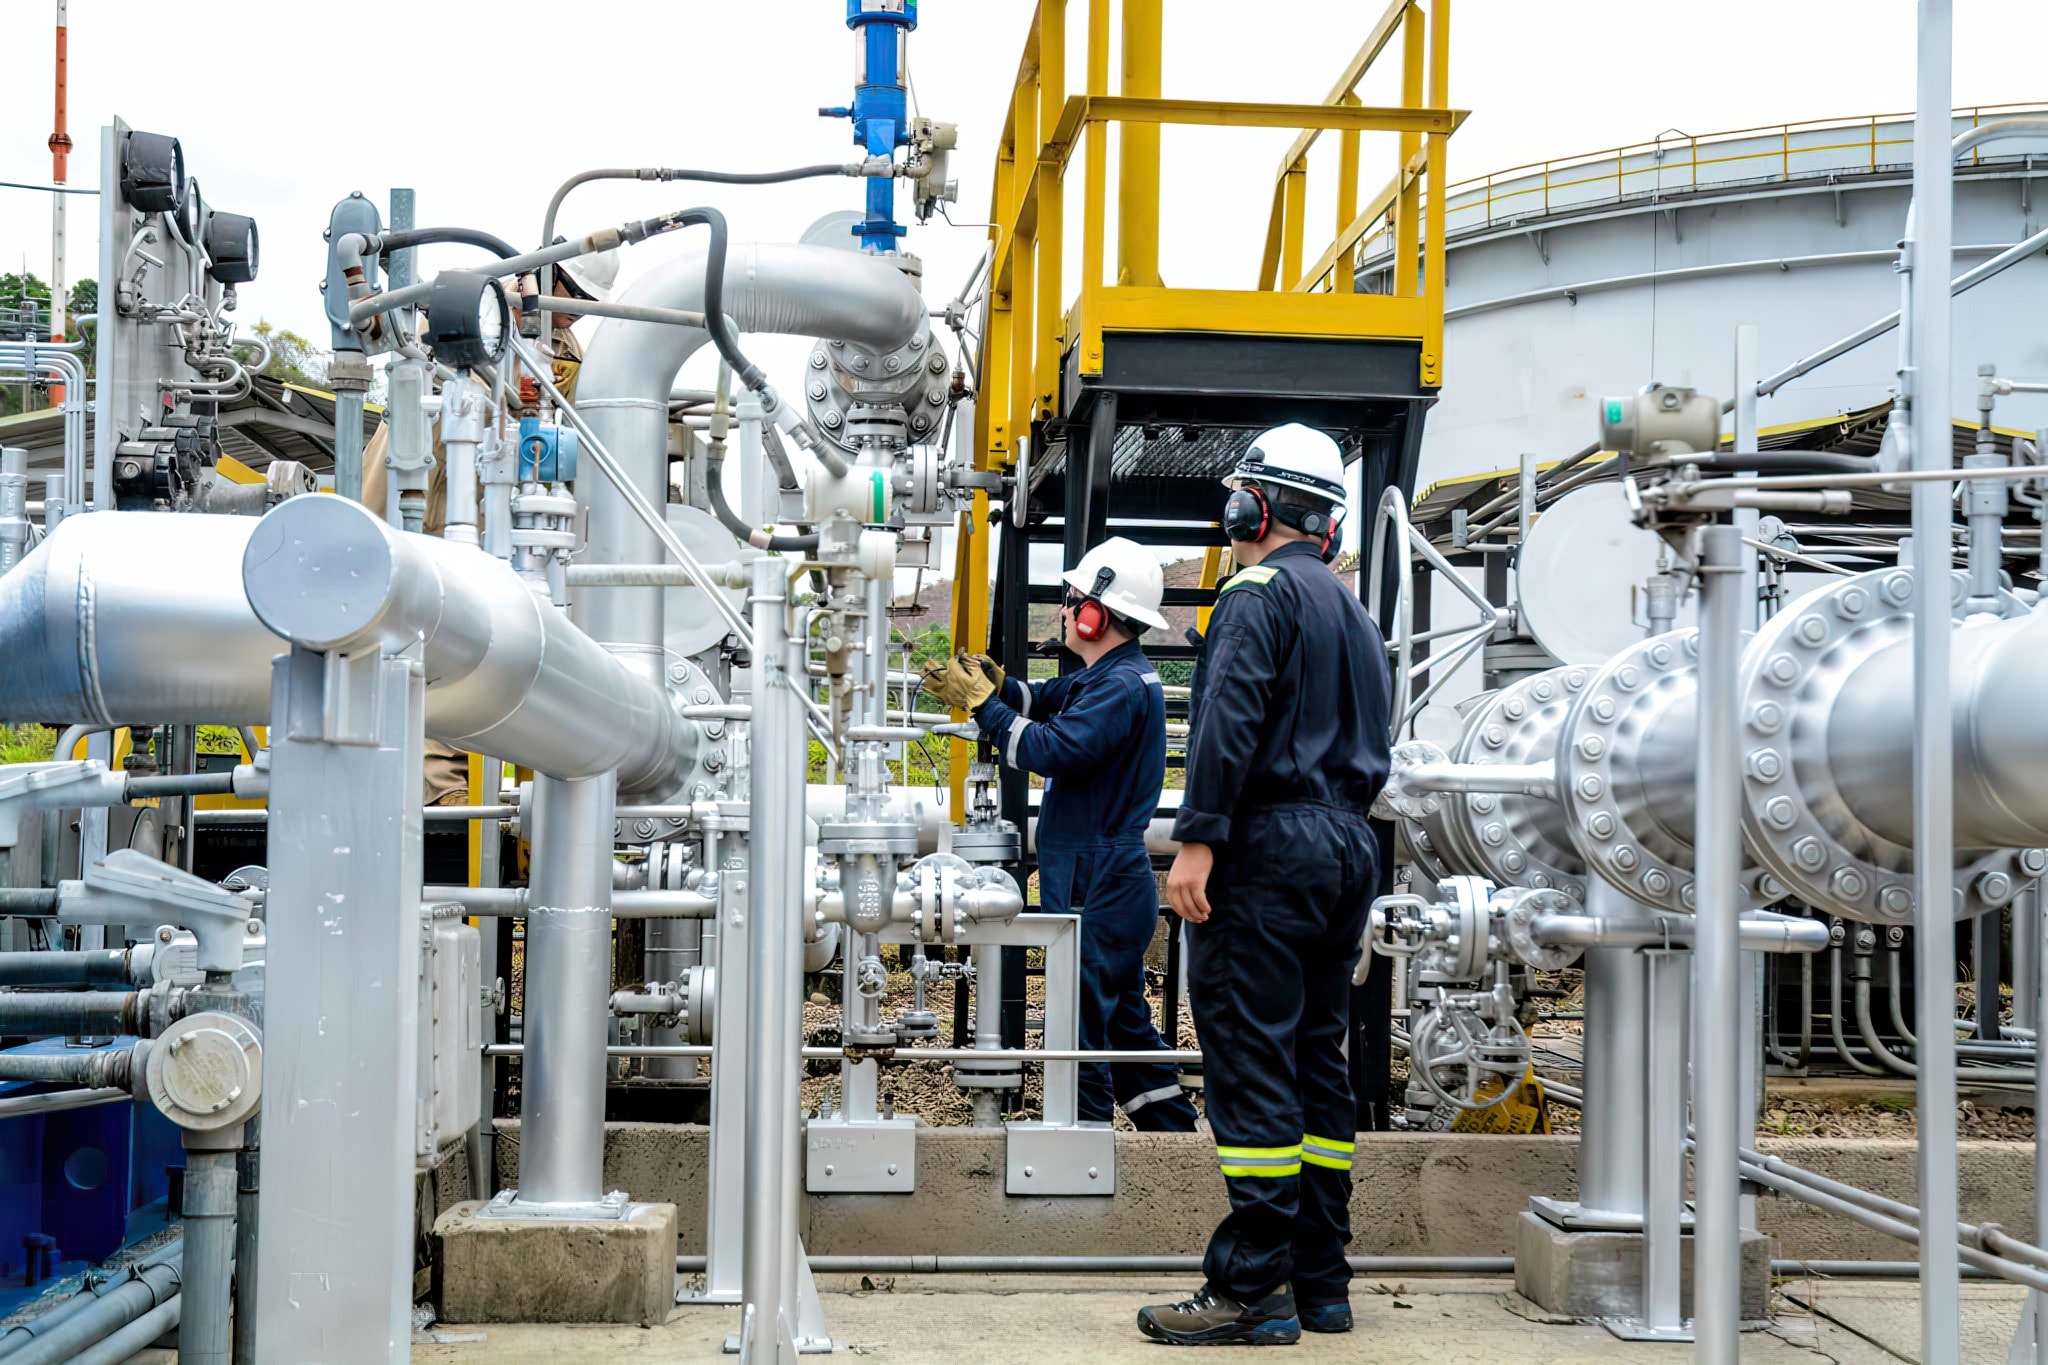
Roadmap
Air Quality
Notable
material element
| Impacted Stakeholder Groups | Areas that manage the impacts: | Ecopetrol business line or segments generating the highest impact |
|---|---|---|
| Society and Community | VTI | Midstream |
| State | VDS | Downstream |
| Customers | VHSE | Commercial |
| Investors | VRP | |
| VPU |
(GRI 3-3-a, 3-3-b) (WEF 7,)
Why is the Element Material?
Ecopetrol’s operations, especially those handling hydrocarbon combustion and storage processes, hydrocarbon separation from water during treatment, and eventually any system with fugitive emissions, have the potential of generating criteria pollutant emissions (particulate matter, carbon monoxide, sulfur, and nitrogen oxides) and volatile organic compounds -VOCs, which can affect air quality and consequently, people’s right to health, to a healthy environment, and to water, among other rights.
Ecopetrol, as a relevant player in the oil, gas, and energy industry, is committed to preserving the air quality around its operations for the well-being of citizens and the protection of the environment. In 2021, air quality was identified as a notable element in the materiality analysis, for which a roadmap called “Clean Air for the Environment” was structured.
The Company’s operations must monitor and control the emission of criteria pollutants (particulate matter, carbon monoxide, sulfur, and nitrogen oxides) and VOCs, within limits that do not impact the air quality around its operations.
At present, no air quality deterioration associated with the emission of criteria pollutants and VOCs originating from Ecopetrol’s operations have been identified around its areas of operation.
Policies and Commitments
Ecopetrol’s environmental strategy concerning the notable element of Air Quality has encompassed the following objectives:
Reducing the emission of criteria pollutants to world-class standards and contributing to the improvement of air quality to protect the health of our environment
Structuring a verified Inventory of Atmospheric Emissions in the assets operated by Ecopetrol.
Contributing to a sustained level of air quality aligned with WHO standards in the areas of influence of the operations.
(GRI 3-3-d) (WEF 7, 7E, 11E, 13E)
How is the Material
Element Managed?
The Air Quality roadmap bases its aspiration on clean air for the environment, including the following strategic options:

- Prevention: based on standards and best practices applicable to pollutant emissions, permanent monitoring in sensitive and prioritized areas, implementation of technologies and design criteria in fixed sources to monitor, control, and reduce emissions.
- Mitigation: implement an updated and verified inventory of atmospheric emissions, as well as monitoring programs at relevant points of the operation, both for air quality and for the measurement of emissions from fixed sources; define reduction goals and a portfolio of reduction initiatives prioritized by the largest emission sources.
- Collective action: research and technological development programs by means of intersectoral and interinstitutional efforts to improve air quality.
(GRI 3-3-d) (WEF 7, 7E, 11E, 13E)
How is the Material Element Evaluated?
Air Quality is assessed as follows:
Follow-up by measuring emissions and monitoring and modeling air quality in the area of the operation to determine the contribution of own emissions.
Defined criteria pollutant emission reduction objectives, focusing on key areas.
Follow-up on the implementation of emission reduction initiatives, leveraging on best operating practices, control technology, monitoring and surveillance of emissions, and the technological reconversion of processes.
This portfolio includes:
Annual projections for the reduction of criteria pollutants based on GHG emission reduction initiatives within the framework of the decarbonization strategy.
Identification and prioritization of other specific initiatives to reduce criteria pollutants based on technological adjustments or reconversions of key processes in the operation.
Short, Medium, and Long
Term Goals and Projects
Short Term
The below emission reduction targets were established in 2022 for the main criteria pollutants for the period of 2023-2025
2023
reduction target of 3,100 tons of VOCs, 305 tons of NOx,
and 60 tons of SOx.
2024-2025
reduction projections of 4,293 tons of VOCs, 711 tons of NOx, and 2,044 tons of SOx
Medium Term
Implementation of greenhouse gas reduction initiatives planned for 2023-2025.
Execution of the SOx emissions control project at the Barrancabermeja refinery, which is expected to come into operation in 2025.
Evaluation of alternative mitigation measures for other sources of SOx and Volatile Organic Compound emissions.
Systematic update of the initiatives’ portfolio and of reduction targets.
Long Term
Evaluate and prioritize the implementation of technological alternatives for the continuous monitoring of air quality in key areas.
Main Achievements in Managing
the Air Quality Roadmap
Progress was made in 2022 on the following elements of the air quality roadmap:
Updating of the procedure for the consolidation, loading, and management of Ecopetrol atmospheric emissions.
Development of a methodology for updating criteria pollutant emission factors to improve the accuracy of the emissions inventory in the SAP-EC tool.
Establishment of criteria pollutant emission reduction goals based on the portfolio of projects to reduce SOx emissions at the Barrancabermeja refinery and the portfolio of decarbonization initiatives.
Methodological and regulatory assurance of air quality monitoring and measurement of emissions from fixed sources, in order to ensure the reliability thereof.
Definition and prioritization of criteria pollutant and VOC emission sources, based on their relevance, to further the analysis of mitigation alternatives.
Monitoring the Effectiveness
of the Measures Adopted
Two (2) types of monitoring are deployed in the areas of operation to establish the effectiveness of the air quality measures adopted:
- Measurements are taken to determine the concentration of criteria pollutant emissions in the main sources, to ensure that there are no significant increases that compromise the air quality.
- Air quality monitoring to determine the concentration of criteria pollutants present in the air around the operation.
The air quality reports produced by accredited entities show no deterioration in the air quality of the areas. In some key areas, continuous monitoring persists in order to manage interventions in an agile and timely manner.
Ecopetrol monitors emissions from more than 200 fixed sources and air quality in more than 250 stations in the areas of operation.
Lessons Learned and Incorporation into
the Company’s Operating Policies and Procedures
No air quality deterioration events have materialized to date that require root cause analyzes leading to lessons learned. However, the reports to stakeholders such as DJSI, CDP, Sustainalytics, and others, and the standards of organizations such as GRI and IPIECA, have allowed the Company to compare and evaluate its comprehensive air quality management with respect to best practices and global trends in the oil & gas sector, and consequently update its internal policies and procedures.
How are Stakeholders Involved in
Taking Action to Manage Air Quality?
The results of the air quality measurements and the emissions from the equipment with the greatest potential for generating criteria pollutant emissions are sent to the environmental authorities within established timeframes. This information is publicly available to any stakeholder group.
(GRI 305-7,11-3-2) (TCFD M-1.2.2) (WEF 7E,8E)
| Emissions | Unit of measurement | 2019 | 2020 | 2021 | 2022 |
|---|---|---|---|---|---|
| NOx | Kt | 27.95 | 28.55 | 28.43 | 28.74 |
| SOx | Kt | 16.65 | 13.26 | 14.45 | 15 |
| Persistent Organic Pollutants (POPs) | Kt | NA | NA | NA | NA |
| Volatile Organic Compounds (VOCs) | Kt | 127.85 | 125.97 | 116.94 | 123.2 |
| Hazardous Air Pollutants (HAPs) | Kt | NA | NA | NA | NA |
| Particles (PM) | Kt | 1.61 | 1.42 | 1.39 | 1.54 |
| Other air emission categories identified in relevant regulations | Kt | 11.3 | 11.67 | 11.58 | 11.43 |
Note 1. Atmospheric pollutant emissions are calculated using mass balances for sulfur oxide (SOx) emissions in combustion systems; as well as emission factors for the remaining pollutants: particulate matter (PM), nitrogen oxides (NOx), Volatile Organic Compounds (VOC), and carbon monoxide (CO).
Note 2. The emission factors used to calculate criteria pollutants (NOx, SOx, particulate matter, and carbon monoxide) and volatile organic compounds (VOCs) are mostly taken from Document AP-42 of the United States Environmental Protection Agency (EPA).
Note 3. In some particular cases, the emission factors from the following references are used:
- Compendium of greenhouse gases emissions methodologies for the oil and gas industry from the 2009 API.
- Methodologies for Atmospheric Emission Inventories in the Oil Industry. 1999. – Regional Association of Oil and Natural Gas Companies in Latin America and the Caribe (ARPEL):
- (EEA)EMEP/EEA Air pollutant emissions Inventory Guidebook 2019: Technical guidance to prepare national emission inventories – European Environmental Agency.
- EIIP Vol II Ch 14 Uncontrolled emission factor listing for criteria air pollutants – Emission Inventory Improvement Program July 2,001.
Note 4: Carbon monoxide (CO) emissions are reported within the category of other relevant air emissions.
Note 5. Persistent organic compounds (POPs) are not part of the Company’s raw materials, supplies, or product portfolio; it is therefore not necessary to record potential emissions from this category of compounds and there is no report or estimate of their emissions.
Note 6. Hazardous air pollutants (HAP) are managed, from an occupational standpoint, through an epidemiological surveillance system implemented in specific areas, in such a way that it allows the identification and assessment of risk areas and exposure groups, the evaluation of the impact on the health of workers, and the proposition of prevention, management, and control alternatives. The most relevant substances are aromatic hydrocarbons and solvents, whose emissions are reported in the volatile organic compound (VOC) and sulfur oxide (SOx) emissions inventory.
(SASB EM-EP-120a.1) (TCFD M-1.2.2) [tfcd src=”XVI”]
| Atmospheric emissions | Unit of measurement | 2019 | 2020 | 2021 | 2022 |
|---|---|---|---|---|---|
| NOx emissions | TonNOx | 22,227 | 23,597 | 23,226 | 23,297 |
| SOx emissions | TonSOx | 3,809 | 3,906 | 3,871 | 3,733 |
| VOC emissions | TonVOCs | 101,792 | 105,246 | 90,188 | 97,584 |
| PM10 emissions | TonPM10 | 895 | 812 | 783 | 847 |
Note 1. Data reported from the exploration and production segment of the hydrocarbons business line.
Note 2. Atmospheric pollutant emissions are calculated using mass balances for sulfur oxide (SOx) emissions in combustion systems; as well as emission factors for the remaining pollutants: particulate matter (PM), nitrogen oxides (NOx), and Volatile Organic Compounds (VOC).
Note 3. The emission factors used to calculate criteria pollutants (NOx and PM, nitrogen oxides and particulate matter) and volatile organic compounds (VOCs) are mostly taken from Document AP-42 of the United States Environmental Protection Agency (EPA).
Note 4. In some particular cases, the emission factors from the following references are used:
- Compendium of greenhouse gases emissions methodologies for the oil and gas industry from the 2009 API.
- Methodologies for Atmospheric Emission Inventories in the Oil Industry. 1999. – Regional Association of Oil and Natural Gas Companies in Latin America and the Caribe (ARPEL):
- (EEA)EMEP/EEA Air pollutant emissions Inventory Guidebook 2019: Technical guidance to prepare national emission inventories – European Environmental Agency.
- EIIP Vol II Ch 14 Uncontrolled emission factor listing for criteria air pollutants – Emission Inventory Improvement Program July 2,001.
Note 5. In the case of particulate material emissions, the emission factors used for calculation correspond to total Particulate Material regardless of size.

[gri src=” 305-6″] [fcfd src=”M-1.2.2″]
| Emissions | Unit of measurement | 2019 | 2020 | 2021 | 2022 |
|---|---|---|---|---|---|
| Emission of Ozone Depleting Substances (ODS) | Ton | 1.32 | 1.32 | 0.19 | 0.35 |
Note: Ecopetrol does not produce, export, or sell these substances (neither in bulk nor in products that contain them); it has only purchased the equipment that contains them from various suppliers, such as stationary air conditioners and refrigerators and fire-fighting systems, among others. The Company is therefore not an importer or exporter of this type of substance.
(GRI 305-6) (TCFD M-1.2.2)
| Equipment category | Unit of measurement | 2019 | 2020 | 2021 | 2022 |
|---|---|---|---|---|---|
| Small-sized domestic/commercial applications (loads between 0 and 5 lbs or 0 and 2.3 Kg) | # | 678 | 678 | 94 | 1,288 |
| Medium and large commercial applications (loads between 5 and 15 lb or 2.3 and 6.8 Kg) | # | 86 | 86 | 220 | 461 |
| Industrial applications (loads greater than 15 lbs or 6.8 Kg) | # | 619 | 619 | 223 | 127 |
| Total | # | 1,383 | 1,383 | 537 | 1,876 |
Note 1. ODS emissions are reported using the advanced level 2a method of the Intergovernmental Panel of Experts on Climate Change (IPCC) and the Ozone Layer Depletion Potentials reported in the Montreal Protocol manual.
Note 2. The substances used for calculation are the following ODS: CFC-12. HCFC-22.
Note 3. ODS substitute substances used in refrigeration and fire systems are not included in the calculation as they have zero ozone depletion potential.
Note 4. Advanced Tier 2a Method (bottom up) of the IPCC. The bottom-up approach considers the time interval between consumption and emission, explicitly through emission factors; it is based on the number of products and end uses where the chemicals are consumed and released. With this approach, real annual emissions are estimated based on the units of equipment that use these chemicals, the average load of the substance, the average service life, emission rates, recycling, and disposal, among others. This method was selected because, although Ecopetrol S.A. is a consumer of ODS substances or their substitutes, the Company does not produce, export, or sell these substances (neither in bulk nor in products that contain them); it has only purchased equipment containing them from several suppliers, e.g., stationary air conditioners and refrigerators, and fire-fighting systems.
Note 5. ODS emissions, in the case of mixtures and other ODS substances, are calculated using the emission factors recommended by the Intergovernmental Panel of Experts on Climate Change – IPCC (EF 1% for units with loads of less than 5 Lb, FE 17% for units with loads greater than 5 Lb).