III.1. Ecopetrol advances in its 2040 Strategy:
Energy that Transforms
Since the publication of the 2040 Strategy “Energy that Transforms”, the Ecopetrol Group has been advancing steadily in its implementation and has consequently positioned itself as an energy group that transitions towards new forms of energy, without neglecting its competitiveness in the hydrocarbon business, increasingly decarbonizing its operations, and strengthening the TESG pathway.

The following aspects stand out from the three (3) business lines of the Ecopetrol Group:
- i) Hydrocarbons currently accounting for roughly 88% of the Group’s EBITDA.
- ii) Low emission solutions, where the challenge is for it to represent at least 14% of EBITDA by 2040.
- iii) Transmission and toll roads contributing approximately 12% of the Group’s EBITDA (2022) but with the aspiration that it generates close to 26% of EBITDA by 2040.
By 2040, the low emissions and transmission and toll roads businesses are expected to jointly contribute between 30% and 50% of EBITDA.
Growing with the energy transition
The hydrocarbon business is vital for the growth of the Group and, in this sense, the commitment to sustain a production of 800 to 850 KBPED in 2030 remains, focusing on the proper management of basic production, consolidation of the enhanced recovery program, profitable production in the Permian in the United States, offshore exploration in the Colombian Caribe region, as well as the fields in the Piedemonte and the Eastern Plains. Ecopetrol has set out to diversify the production of hydrocarbons until reaching a sustained 30% market share in the gas sector by 2040.

The long-term aspiration in the midstream segment is to increase resilience to maintain the value at around 2.2 TRILLION USD in EBITDA for this segment. Along this path, the strategic lines to secure the business are as follows: maintain the competitiveness of the oil pipelines, grow in multiple pipelines, port optimization, diversification towards gas infrastructure, and internationalization.
In order to ensure cleaner and more profitable fuels, as well as protect the country’s energy sovereignty, Ecopetrol continues on the path towards maximizing the margin of its refineries, as well as enhancing the value of virgin naphtha in Cartagena and continue reducing the sulfur content in the fuels produced (less than 10 ppm sulfur in diesel by 2025 and less than 10 ppm sulfur in gasoline by 2030).
With regard to the commercial segment of the hydrocarbon line, we inaugurated our trading subsidiary in Singapore (Ecopetrol Trading Asia) in September 2022, which will help us increase the commercial value of our products and strengthen geographical position worldwide.
From the diversification perspective, ISA, an Ecopetrol Group subsidiary, was integrated successfully. For the reported period, the company represented 12% of the Group’s EBITDA, thus consolidating its entry into the electric chain transmission segment. The long-term objective is to continue growing organically and inorganically in the transmission business and venture into large-scale energy storage projects. For this strategy, the purpose is to invest roughly 36 TRILLION USD by 2030.
On the other hand, we launched the roadmap for the production of at least 1 million tons of low-carbon hydrogen (H2) by 2040, which implies an investment of 2.5 TRILLION USD and an expected long-term return of +400 MUSD in EBITDA. The first goal for 2030 is to produce 47 thousand tons of H2 for our own consumption and for export. Similarly, Ecopetrol is structuring the roadmap towards the capture, use, and storage of carbon dioxide CO2 (CCUS).
In terms of self-generation of non-conventional renewable energy, the aspiration by 2030, is that at least 30% – 40% of our own energy consumption comes from green sources. In 2022, Ecopetrol produced 208 MW from solar energy, among other sources, which paves the way for the goal of 900 MW by 2025 (solar, wind, biomass, and geothermal).
Generating value with TESG
TESG at Ecopetrol refers to performing responsible, safe, and efficient operations, in a harmonious relationship between the Stakeholders Groups and the environment; under a transparent and ethical governance framework, and making use of technology to develop innovative solutions to address current and future challenges.
In this sense, the Ecopetrol Group is committed to the goal of net zero emissions by 2050 in Scopes 1 and 2 (own operations and those related to the operation). To this end, the Group has focused on the reduction of fugitive emissions, an energy efficiency of up to 10%, and the incursion into natural climate solutions in the short and medium term, as well as H2, CCUS, and energy storage in the long term.
Moreover, Ecopetrol is geared towards integrated water management to minimize water catchment, thus avoiding dumping into bodies of fresh water and compensating until reaching an adequate balance. Ecopetrol currently reuses 77.5% of the water produced by its operations, and it aspires to raise this number to 90%, which will ensure the use of neutral water by 2045.
Finally, the 2040 Strategy accounts for the sustainable development of the territories through social investment; for which we expect to invest some 472 billion COP in 2023, benefiting communities with education, roads, and access to public services. In terms of social gas, Ecopetrol was able to connect 7,683 new users in 2022, with the goal of servicing 75,000 by 2030. And on the matter of labor force, the Ecopetrol Group generated close to 73,000 unskilled labor jobs hired locally through contractors, with a 28% increase in the employment of people facing difficult labor placement.
Cutting-edge knowledge
The science, technology, and innovation (CT+i) strategy is at the heart of TESG and will enable between 20 and 30 TRILLION USD of accumulated EBITDA by 2040. To take on this challenge, Ecopetrol has set itself out be an orchestrator of ecosystems focused on technology clusters to solve the challenges posed by the 2040 Strategy:
Decarbonization
Energy transition
TESG
Resilient assets
Circular economy
The 5.0 industrial revolution
With this strategy, Ecopetrol expects to execute roughly
400 MUSD
per year in CT+i investments.
Furthermore, Ecopetrol is committed to equipping its human talent with the necessary skills to face the challenges of growing with the energy transition. To this end, it hopes to instill 70% of the required cutting-edge skills in its employees to strengthen the 2040 Strategy, with levers such as training programs, the appropriation of culture, emotional connections with people, and talent and leadership redevelopment.
Competitive Returns
The Ecopetrol Group’s 2040 vision seeks to generate competitive and sustainable financial returns for shareholders and investors, by strengthening EBITDA through 30% – 50% gradual diversification from low emission businesses by 2040, maintaining a ROACE between 8% and 10%, maintaining the capital structure at a gross debt/EBITDA ratio consistent with investment grade (<2.5x), and ensuring contributions to the Nation in the range of 13 TRILLION COP to 20 TRILLION COP (royalties, taxes, and dividends).
The Company has strengthened the efficiencies program as a strategic line to ensure cost optimization in a structural way, thus mitigating the inflationary effects on OPEX and amassing 20 TRILLION COP since 2015.
It has similarly been increasing the level of investments, maintaining capital discipline with a ROACE greater than 13% in the last two (2) years and an investment record close to 5.4 TRILLION USD in 2022.
III.2. Business Plan
In 2022, the Company presented its long-term vision to the market, incorporating the contribution of each of the business lines to the financial results, as well as their growth and return expectations for related parties. One of the most relevant achievements of the business plan is Ecopetrol’s unified vision as an energy group that undertakes its operations in a profitable manner and in alignment with its decarbonization objectives. In the same way, the business plan shows the gradual adoption of low-emission businesses within the Company’s portfolio and includes the roadmap for these alternatives to be part of the incubation and become EBITDA generators for the Group in the medium and long term.
However, the roadmap proposed through the business plan poses challenges for Ecopetrol, since it implies guaranteed monitoring of the gradual fulfillment of the objectives associated with the competitiveness and sustainability of the hydrocarbon business line, while incorporating businesses associated with the reduction of greenhouse gas (GHG) emissions. Similarly, one of the challenges of the 2040 Strategy, which is directly highlighted in the business plan, is to ensure the Group’s growth and value generation for its three (3) business lines. Ecopetrol, as an energy group, seeks long-term EBITDA growth, a ROACE above the cost of capital, a payout to its shareholders between 40% and 60%, and leverage indicators in line with investment grade expectations. The achievement of these objectives goes hand in hand with constant monitoring based on the business plan to detect early warnings for the fulfillment of the strategy.

Expansion into the Permian (Delaware sub-basin)
In June 2022, Ecopetrol Permian LLC (an Ecopetrol subsidiary) and several OXY subsidiaries entered into a Joint Development Agreement (JDA) to develop drilling and production programs in the Delaware sub-basin in the Permian basin, within an approximate area of 21,000 acres over the period of 2022 – 2027. Said agreement allows Ecopetrol to expand its presence in the Permian, representing 49% of the rights in the drilling and production programs in the area.
Ecopetrol did not make any initial payment to enter the area. It will cover a percentage of OXY’s development investment (up to 75%) as the carry advances. The carry percentage to be covered by Ecopetrol will be linked to the price of one barrel of oil (WTI), which will be set during the course of the drilling activity. The activity in Delaware initiated in the fourth quarter of 2022 and production will increase starting the first quarter of 2023.
Moreover, an amendment was executed to the JV in Rodeo, granting Ecopetrol a greater stake in production (75%) as well as a deferral of its current obligations under carry until 2025. The effective date of this modification was January 1st, 2022, and it had a favorable impact on production by year end, with a 95% increase compared to 2021.
ISA’s Transition
With the acquisition of 51.4% of ISA and its companies, the transition process to the Ecopetrol Group’s control and reporting scheme ended in 2022, as well as the exploration and materialization of the first wave of synergies. Compliance with the legal and financial requirements associated mainly with the approval of the 2021 consolidated financial statements, the implementation of SOX controls in ISA, and the definition of the governance and interaction model were also achieved successfully. With regard to value generation, synergies were materialized in eight (8) thematic areas, including higher reliability of Ecopetrol’s electrical infrastructure by applying ISA’s cutting-edge expertise, the definition of the Conexión Jaguar program’s scaling strategy as a contribution to the carbon credit offer for the Ecopetrol Group, savings in the supply of common expense categories, and increased resilience in the supply chain. We will continue strengthening synergies and capturing value for the Group.
2022 Brazil Round
Ecopetrol Brasil participated in ANP’s Third Cycle of Permanent Offer held on April 13, and was awarded six (6) offshore blocks in the southern region of the prolific Santos basin, with a 30% stake, and Shell with a 70% stake as operator. The blocks that Ecopetrol is entering are the following: S-M-1599, S-M-1601, S-M-1713, SM-1817, S-M-1908, and S-M-1910. These concession contracts were signed on November 7 and 8. This new acquisition completes a total of 12 blocks in Brazil, of which 10 are exploratory and two (2) additional ones are in the development phase.
Exploration Agreement
with Anadarko (Oxy)
In the month of May, Ecopetrol and Anadarko Colombia Company, an OXY subsidiary, entered into a joint exploration agreement in the COL 1, COL 2, COL 6, and COL 7 blocks, located in deep waters to the northeast of the Colombian Caribe region, with the purpose of embarking on the search for hydrocarbons in an area with attractive potential. Ecopetrol will have a 40% stake in exploration and production rights, and Anadarko the remaining 60% as operator of the blocks. The agreement has already been formalized at the National Hydrocarbons Agency (ANH). The blocks are located off the coast, at an average distance of more than 150 km from the coastline.
III.3. 2022 Results for the Year
International market environment
for crude oil and related products in 2022
In the first half of 2022, Brent Crude maintained an upward trend, driven by favorable demand growth (the global economy continued to expand at a good pace and mobility continued to recover rapidly). The offer also contributed to the rise in the Brent price, with a slow growth in supply due to a very cohesive OPEC (the group’s production was below the agreed quotas all year), a Non-OPEC production that grew very slowly given the strict capital discipline of the industry in recent years, and the prospects of lower supply of Russian crude following the sanctions imposed on this country after the invasion of Ukraine at the end of February. In this context, the Brent price rose from 86 USD/bl in January 2022 to 118 USD/bl in June that year.
This upward trend was interrupted in the second semester. On the one hand, global inflationary pressures and the high price of fuels discouraged consumption in the economies. In line with the above, the central banks, pressured by inflation, embarked on an upward cycle of interest rates that deteriorated the economic outlook by the end of 2022 and the beginning of 2023. On the other hand, high gas prices, especially in Europe, due to the lower Russian supply, degraded the confidence levels and the economic activity of this continent. Finally, China’s “zero-Covid” policy strongly impacted the demand of that country, accounting for a negative growth in its consumption of 400 kbd of oil for all of 2022, a situation unseen in many years. This deterioration in demand led OPEC+ to announce a 2 mmbd production cut in October, which prevented a further decline in the Brent. Given this situation, the Brent price fell throughout the second semester to a minimum of 81 USD/bl in December 2022.
In total, the average Brent stood at 99 USD/bl in 2022, far exceeding the value of 71 USD/bl in 2021. Geopolitical factors played a crucial function in determining the price in 2022, since the market balance showed a slight accumulation of inventories globally: according to Platts, average supply in 2022 was at 101.2 mmbd, 740 kbd above demand (in OECD countries, however, there was a slight reduction in crude inventories).

Refineries continued on the positive path of 2021 in their 2022 operating margins. Product cracks benefited from the recovery in demand, especially in the first half of the year, which was not accompanied by a rapid recovery in supply, despite the high cracks, given the reduction in global refining capacity, which decreased in net terms by close to 1 mmbd in 2020 and 2021. This dynamic kept global gasoline and especially diesel inventories at low levels for a good part of the year. The Russia-Ukraine conflict also favored product cracks, especially diesel: the reduction in the supply of Russian gas to Europe in 2022 raised gas prices in this continent (practically tripled between 2021 and 2022), thus raising the cost of processing for refineries, which should have experienced higher income (via diesel crack, their main refining product) to guarantee their operation. Finally, refineries also benefited from lower costs in their diet vs. the one in 2021: the diversion of Russian crude to other markets, especially Asia, at high discount rates, deteriorated the spreads of intermediate and heavy crudes. In total, the global refining margin, an average of the margins in the main refining centers, stood at 8.4 USD/bl in 2022, more than doubling the margin of 3.4 USD/bl in 2021.

Moderate optimism is maintained for 2023. Several agencies and multilateral organizations have reduced their growth forecast for 2023, mainly as a consequence of interest rates rising globally. The World Bank, for example, recently adjusted its 2023 growth forecast to 1.7%, from the 3.0% it had expected six (6) months ago. OPEC+ remains cohesive and any strong deterioration in demand would surely be accompanied by a similar adjustment in the group’s production, which seeks to maintain a market balance consistent with a crude oil price of at least 80 USD/bl. Moreover, the abandonment of the “zero-COVID” policy by China at the end of 2022 anticipates a significant consumption recovery in that country that would serve as support for Brent and other commodities and that would counteract the deterioration in demand in other geographies. Refining margins would remain high, in historical terms, although they would see a decline versus the levels of 2022: new refining capacity, coupled with a slowdown in demand, would help diesel and gasoline inventories to rise close to the averages of the last five years.
The international gas and
LNG market environment
The conflict between Russia and Ukraine, in addition to the maintenance works and sabotages of the Nordstream gas pipeline, which carries gas from Russia to Germany, has resulted in a significant TTF benchmark price increase in continental Europe. The indicator experiences a shift greater than 98%4, reaching a record high of 106 USD/Mbtu.
Alerts on a shortage of natural gas during wintertime in Europe led several countries like Germany to reconsider electricity generation based on fuels such as coal to complement generation using natural gas.
LNG imports peaked in August, with most flows destined for Europe to fill storage levels and face increased winter demand. With this and other measures such as promoting savings in consumption, Europe managed to fill 83% of its storage capacity at the end of December, to a level that is expected to cover its energy requirements during the winter.
Limited regasification infrastructure in Europe led to delayed vessel unloading and increased floating LNG storage to back up unmet demand, driving daily freight rates to as high as $470,000/day in the Atlantic basin, which represents an increase of 365% compared to the average rate of 2021.
Concerns about dependence on Russia’s natural gas have increased the number of floating storage regasification unit (FSRUs) construction projects, mainly in Europe. 23 regasification units are expected to come into operation by 2023, especially the entry of two (2) units in Germany with a capacity of 6.1 Mtpa.
The above measures are expected to guarantee Europe’s energy security to face a 2023, in which, most likely, no natural gas flows will be received from Russian.
The lack of reliability in the natural gas supply due to the aforementioned situation led to the replacement of natural gas with alternative sources such as coal or liquids for generation, in addition to lower household consumption in response to the high gas rates, mainly in Europe. The accumulated global demand deterioration is expected to reach 55Mm3 by November, with 90% corresponding to demand from the European market.
Entorno economía colombiana 2022
The Colombian economy grew at a rate of 7.5% in 2022, one of the highest in the region, thereby consolidating the country as one of the economies with the strongest recoveries in the world, growing 11.0% in 2021 after the recession caused by the pandemic in 2020.
The expansion of the economy was leveraged by a growth in consumption. Household spending grew at an average annual rate of 9.5%, driven by the recovery of employment (more than 1.6 million jobs were created in 2022 vs. the same period in 2021) and the growth of consumer credit, which was growing at a rate of more than 20% per year by the end of 2022. Investments also recorded positive growth, averaging 11.8%, throughout the year. From the external perspective, imports, driven by the boom in domestic consumption, grew much faster than exports (24% vs. 15%), subtracting momentum in the growth of the entire economy.
The strong growth in consumption not only affected foreign accounts, increasing the current account deficit to 7.2% of GDP in the third quarter, one of the highest in history, but was also an important factor in raising inflation. 2022 closed with a 13.1% inflation rate, the highest since 1999, where, in addition to demand pressures, price dynamics were also driven by the exchange rate depreciation (14% in annual terms) and by supply chain issues.
This demand, as well as the price dynamics, led Banco de la República to raise its rates throughout 2022 by eight (8) percentage points, up to 12% by year end. This strong rate increase, in addition to the high inflation and the slowdown in foreign demand, will have a negative impact on consumption and investment in 2023. Accordingly, a significant moderation in economic growth is expected, with a GDP growth that could be close to 1.0% in 2023.
Ecopetrol’s growth and
contribution to Colombia’s GDP
Contribution of the oil sector to the Gross Domestic Product (GDP)
In 2022, the behavior of GDP in the mining sector presented a slight increase of 0.6% compared to the previous year, mainly due to:
- i) 2.5% growth in oil and gas extraction activities.
- ii) 3.9% growth in metallic mineral extraction activities, exploitation of other mines and quarries, and support activities for other mines and quarry exploitation activities.
- iii) –5.4% contraction of stone coal and lignite extraction activities.
The growth in the oil and gas extraction indicator was due to the increase in crude oil production, which averaged 754 kbd in 2022 compared to 736 kbd in the previous year.
Ecopetrol’s growth and contribution to the national GDPl
Ecopetrol’s contributed 2.3% to the national GDP in 2022. This lower contribution compared to the previous year is mainly because Ecopetrol’s increase in production in Colombia stood at 2.1% (662 kbd in 2022 vs. 649 kbd in 2021) compared to the country’s increase in production of 2.4%.
Oil Sector Contribution to GDP (billion constant pesos in 2015)
| 2021 | 2022 | |
|---|---|---|
| National GDP | 907,352 | 975,365 |
| Oil extraction GDP | 24,813 | 25,444 |
| Contribution to GDP from the oil sector | 2.7% | 2.6% |
| Contribution to GDP by Ecopetroll | 2.4% | 2.3% |
Financial strategy and resultss
The Ecopetrol Group closed 2022 with the best financial results in its history, with a net profit of COP 33.4 trillion, doubling that of the previous year, and an EBITDA of COP 75.2 trillion with an EBITDA margin of 47%. This solid financial performance was leveraged by:
- i) The favorable pricing environment.
- ii) Higher production contributions from the Permian and Ecopetrol S.A.
- iii) Record results in the refineries.
- iv) Solid results from ISA.
The foregoing allowed the Group to offset:
- i) Inflation and the exchange rate effect on operating costs and expenses.
- ii) Higher debt interest rates.
- iii) Higher level of exploratory expenses.
- iv) The increase in the nominal income tax rate for 2022.
Accumulated revenues at the end of 2022 increased by 73.8% compared to 2021 as a result of:
- i) Higher weighted average sales price of crude oil, gas, and products.
- ii) Higher average TRM.
- iii) Higher sales volume due to increased production from the Permian and Ecopetrol S.A., and the growth of domestic demand for fuel and gas products.
- iv) Greater services throughout 2022, mainly due to the consolidation of ISA’s revenues, compared to only four (4) months in 2021.
The foregoing was partially offset by lower exports of middle distillates, given the major maintenance scheduled at the refineries.
Sales costs, including variable and fixed costs for 2022, experienced a 60.9% increase compared to 2021, as a result of:
- i) Larger crude oil, gas, and product purchases due to greater fuel requirements to meet the economic recovery of the market and major maintenance scheduled during the year at the refineries, as well as increased purchases of crude oil for the start-up of the crude oil plant interconnection project in Cartagena.
- ii) Higher operating activity costs due to increased activity, tariff rise in contracts, the exchange rate, the inflationary effect, larger purchase of energy, as well as fewer Covid-19 restrictions.
- iii) Higher labor costs due to salary increases and greater provision of health services.
- iv) Consolidation of ISA’s results throughout 2022 versus just four months in 2021.
Operating and exploratory expenses also rose at the end of 2022 compared to 2021 due to:
- i) The single recognition in 2021 of an income in Cenit and Oleoducto Bicentenario, as a result of the settlement reached with Frontera.
- ii) The incorporation of ISA’s results throughout 2022 compared to four months in 2021.
- iii) Increased exploration expenses due to the recognition of exploratory activities in unsuccessful wells and greater activity in Ecopetrol Brazil and Hocol.
- iv) The increase in customs operations mainly due to the larger volume of DAP sales.
- v) Greater social investments executed through agreements and community aid, as well as higher taxes and inspection fees, among others.
Financial expenses recorded increases by the end of 2022 compared to 2021 due to:
- i) The incorporation of ISA’s net financial results throughout 2022 compared to just four months in 2021.
- ii) Higher interest rates on the debt acquired in the second half of 2021 to finance the purchase of ISA and the exchange rate effect on debt-related interest in dollars.
- iii) Increased expenses due to exchange rate differences, mainly pertaining to the income associated with the conversion adjustment of the investment in dollars made in Savia, as a result of its sale in 2021, as well as the devaluation of the peso against the dollar given the Ecopetrol Group’s net liability position in dollars in 2022.
The foregoing was partially offset by higher yields and the appreciation of the investment portfolio and bank accounts.
Investment analysis
In 2022, the Ecopetrol Group executed organic capital investments in the amount of 5,488 BUSD, reaching the high range of the goal set for 2022 of 4.8 BUSD – 5.8 BUSD. Of all organic investments in the oil and gas business, 79% were made in Colombia, and the remaining 21% in the US and Brazil.
The investments focused on the growth of the gas chain represented 10% of the investments executed in the year. These investments were mainly driven by the execution of projects in Piedemonte, in the assets of Floreña, Cupiagua, and Cusiana, the offshore exploration blocks, and the projects developed by Hocol.
For its part, ISA’s investments in 2022 amounted to 1.02 BUSD, with 84% concentrated in the energy transmission business (858 MUSD), and 14% (141 MUSD) and 2% (21 MUSD) in the roads and telecommunications businesses, respectively. Brazil and Colombia accounted for 33% and 23% of total investments, respectively, and the remaining 44% corresponded mainly to investments in Chile and Peru.
| Millions (USD) | Ecopetrol S.A. | Affiliates and Subsidiaries | Total 12M 2022 | Share | |
|---|---|---|---|---|---|
| Production | 2,156 | 982 | 3,138 | 70.2% | |
| Refining, Petrochemicals, and Biofuels | 220 | 218 | 438 | 9.8% | |
| Exploration | 280 | 158 | 439 | 9.8% | |
| Transport* | 0 | 320 | 320 | 7.2% | |
| Corporate** | 134 | 0 | 134 | 3.0% | |
| Total without ISA | 2,790 | 1,679 | 4,468 | 100.0% | |
| Energy transmission | 0 | 858 | 858 | 84.1% | |
| Toll roads | 0 | 141 | 141 | 13.8% | |
| Telecommunications | 0 | 21 | 21 | 2.1% | |
| Total ISA | 0 | 1,020 | 1,020 | 100.0% | |
| Total | 2,790 | 2,698 | 5,488 | – |
*Includes the total amount of investments by each of the companies under the Ecopetrol Group (Ecopetrol S.A.’s share and non-controlling interest).
**Includes investments in energy transition projects.

2023 Business
Plan update
The Ecopetrol Group updated its 2030 Business Plan, in alignment with the Group’s commitment to accelerate towards the path of transition and energy sovereignty in the country, while maintaining competitive returns for all shareholders pursuant to its 2040 Strategy: Energy that Transforms.
The plan contemplates organic investments for 2023 ranging between 5.6 BUSD and 6.6 BUSD. About 66% of total investments will go to projects in Colombia and the remaining 34% will be executed in the US, mainly in the Permian (19%), as well as in Brazil (9%), Peru (3%), and Chile (3%).
The resources from renewable self-generation, hydrogen, energy efficiency, carbon capture, and ISA (transmission and toll roads) represent about 23% of the 2030 investment plan. Around 900 MUSD in the next 3 years (roughly 70 MUSD in 2023), will allow the incorporation of 900 MW of renewable energy, the production of more than 50,000 tons of low-carbon hydrogen, the reduction of about 400,000 tons of CO2e emissions, and the advancement of carbon storage and capture studies.
The commitment to self-sufficiency in the gas business line includes investments ranging between 800 MUSD and 900 MUSD for exploration and production projects in Piedemonte Llanero, the Continental Caribe region, and offshore. The plan seeks to create at least two (2) new regional energy communities and connect close to 107,000 new households to the gas grid.
In addition, ISA will invest roughly 1.4 BUSD (~4.4 BUSD for the next 3 years), of which close to 1.2 BUSD will be used to build 9,657 kilometers of energy transmission lines by 2025 (6,227 kilometers for the transmission of unconventional non-renewable energy), thus consolidating ISA as a leader in energy transmission in Latin America.
Investments in the exploration and production segment will be focused on enhanced recovery technologies to maximize existing resources in the reservoirs and protect the basic curve to offset the natural decline of the fields. Investments in the transportation and refining segments correspond to 5% and 7% of the total plan for 2023, respectively.
In line with the Generating Value with TESG pillar, the plan considers investments close to 500 MUSD, mainly in projects associated with:
- i) Decarbonization (199 MUSD).
- ii) Integrated water management (200 MUSD).
- iii) Fuel quality (64 MUSD).
- iv) Investments related to other areas such as research, circular economy, health and process and industrial safety (46 MUSD).
Some of the most relevant operating and financial goals of the 2023 plan are:
Reduce about 400,000 tons of CO2e emissions and incorporate close to 900 MW of renewable energies and more than 50,000 tons of green hydrogen by 2025.
Build 9,657 kilometers of energy transmission lines by 2025 (6,227 kilometers for the transmission of non-conventional renewable energies).
Production levels between 720 and 725 thousand barrels of hydrocarbon per day in 2023 (76% oil and 24% gas), with potential growth to reach production levels between 730 and 740 thousand barrels by 2024.
Transported volumes greater than one million barrels per day, in line with the country’s production expectations and the demand for refined products.
Volúmenes transportados superiores a un millón de barriles por día, en línea con las expectativas de producción del país y la demanda de productos refinados.
Also, 472 BCOP are planned for social investments, which will strengthen the Group’s commitment to the local development of the regions, to execute the intervention of 240 kilometers of tertiary network in 2023, as well as to provide education for 90,000 students, access to drinking water for 16,000 inhabitants, and serve 13,000 new household gas users, among others.
Finally, the 2023 investment plan involves, among other things, financing with own resources, the collection of the account receivable from the Fuel Price Stabilization Fund (FEPC), and marginal leverage in line with a Gross Debt/EBITDA ratio lower than 2.1 times. The plan will be subject to revision during the first quarter of 2023 based on the evolution of its assumptions.
(GRI 201-1, 201-4) (SFC 7.4.1.2.3, 7.4.1.2.4)
Financial results
Balance sheet
The Group’s assets amounted to 306.4 TRILLION COP, with an increase of 62.1 TRILLION COP compared to 2021, mainly due to:
- i) Larger accounts receivable given the higher value of the FEPC (Fuel Price Stabilization Fund) account and the exchange effect on assets from concessions in ISA Brasil.
- ii) The increase in property, plant, and equipment generated by a higher CAPEX in Ecopetrol and Permian projects, and the positive conversion effect in companies using a functional currency other than the Colombian peso, offset with the depreciations of the year.
- iii) The higher deferred tax asset, generated mainly by the update thereof.
- iv) Larger inventories due to vessels in transit at the end of the year.
- v) Increased investments in associated companies and joint ventures, mainly due to the positive conversion effect of investments made in foreign currency.
The Group’s liabilities stood at 187.3 TRILLION COP, with an increase of 36.8 TRILLION COP mainly due to:
- i) Escalating debt caused by the devaluation of the peso against the dollar in 2022.
- ii) Higher income tax, mainly due to the outstanding results achieved by the Ecopetrol Group companies.
- iii) The increase in accounts payable in line with the expanded activity and prices during the year.
- iv) Better employee benefits, mainly due to a lower appreciation of autonomous equities.
Equity amounted to 119.1 TRILLION COP, of which 91 TRILLION COP corresponds to equity attributable to Ecopetrol shareholders and 28.1 TRILLION COP to non-controlling shareholders.
Detailed information on Ecopetrol’s financial statements (consolidated and unconsolidated) can be found on Ecopetrol’s website.
Indicadores financieros
Below are the results of the financial indicators in 2022:

Liquidity indicators
These correspond to the resources required by the Ecopetrol Group to operate in the short term, maintaining a margin to cover cash fluctuations as a result of current asset and liability operations.
At the end of 2022, current assets increased by 49% compared to the previous year, mainly due to:
- i) The increase in the account receivable from the Fuel Price Stabilization Fund.
- ii) The higher level of inventories due to in-transit vessels.
On the other hand, current liabilities increased by 88% mainly due to:
- i) The transfer of financial obligations maturing in 2023 from long to short term.
- ii) Larger commercial accounts associated with increased activities and higher prices.
- iii) Higher current taxes arising from the improved results.
Debt indicators
These represent the proportion of the Company’s investment financed with debt, that is, using third-party resources.
Total liabilities payable to third parties backed by the level of assets was 61% in 2022 and 62% in 2021. Similarly, the concentration of short-term indebtedness was 30% and long-term 70%.

Profitability indicators
The EBITDA margin for 2022 was 47.2% compared to 45.7% in 2021. In 2022, the Ecopetrol Group’s return on assets (ROA) was 13.6% (2021 – 9.9%), and the return on capital employed (ROACE) was 18.8% (2021 – 13.6%). These rising indicators are mainly due to the higher results in 2022 for all operating segments and Group companies compared to 2021.
Activity indicators
The asset turnover indicator, measured by the value of sales over the Group’s average assets, stood at 0.59 in 2022 (vs. 0.49 in 2021), reflecting the excellent results for the year.
(GRI 201-1) (WEF 18, 21, 32E)
Economic value generated and distributed
The economic value generated and distributed illustrates the basic way in which an organization generates wealth for its Stakeholder Groups. The economic value generated corresponds to the Company’s income.
For its part, the distributed economic value includes: operating costs, employee salaries and benefits, payments to capital providers, payments to the government, and social investments (see table).
| Economic value generated | ||
|---|---|---|
| 2021 | 2022 | |
| Income | 92,147,671 | 159,473,954 |
| Economic value distributed | ||
|---|---|---|
| Economic value | 2021 | 2022 |
| Operating costs (cost of sales and operating expenses) | 62,183,496 | 99,381,325 |
| Employee salaries and benefits (expense) | 1,577,109 | 2,027,302 |
| Payments to capital providers | 6,104,841 | 6,710,106 |
| Payments to the government | 16,771,372 | 42,437,114 |
| Investments in the community | 199,057 | 284,399 |
| Economic value distributed | 86,835,877 | 150,840,247 |
Evolution of Share Prices in Colombia
The COLCAP index, the main reference of the Colombian Stock Market, had a negative variation of 8.85% during 2022. Its maximum level was 1,635 in April, the lowest level occurred in September when it reached 1,112 and closed 2022 at 1,286.
During 2022, Brent appreciated by 10.45%, going from levels of USD ~78/bl at the beginning of 2022 to USD ~86/bl at the end of the year, with a maximum in March of USD ~127/bb and a minimum in December from USD ~76/bl. Ecopetrol’s share price closed the year at 2,420 COP, with a devaluation of 10.04% in the year. The action reached in 2022 a maximum of 3,610 COP in March and a minimum of 1,970 COP in September. Click on the following link for the detailed behavior of share prices in the BVC.
Evolution of the ADR on the New York Stock Exchange
Ecopetrol’s ADR closed 2022 with a price of USD 10.47 and presented a variation of -18.77%. The ADR reached a high of USD 19.65 in April and a low of USD 8.64 in September. Click on the following link for the detailed behavior of Ecopetrol’s ADR.
Relevant information
All relevant information disclosure obligations in Colombia and abroad were complied with. For more information, see Chapter IV.1. of the Corporate Governance Report. Transparency, fluidity, and quality of information.
| Releases of relevant information | 65 |
| Press releases | 430 |
| Documents published in the SEC | 44 |
| Total | 539 |
Capital and
ownership structure
Ecopetrol had
256,206
shareholders
as of December 31, 2022, with a
0.83%
variation in the number of shareholders compared to December 2021.

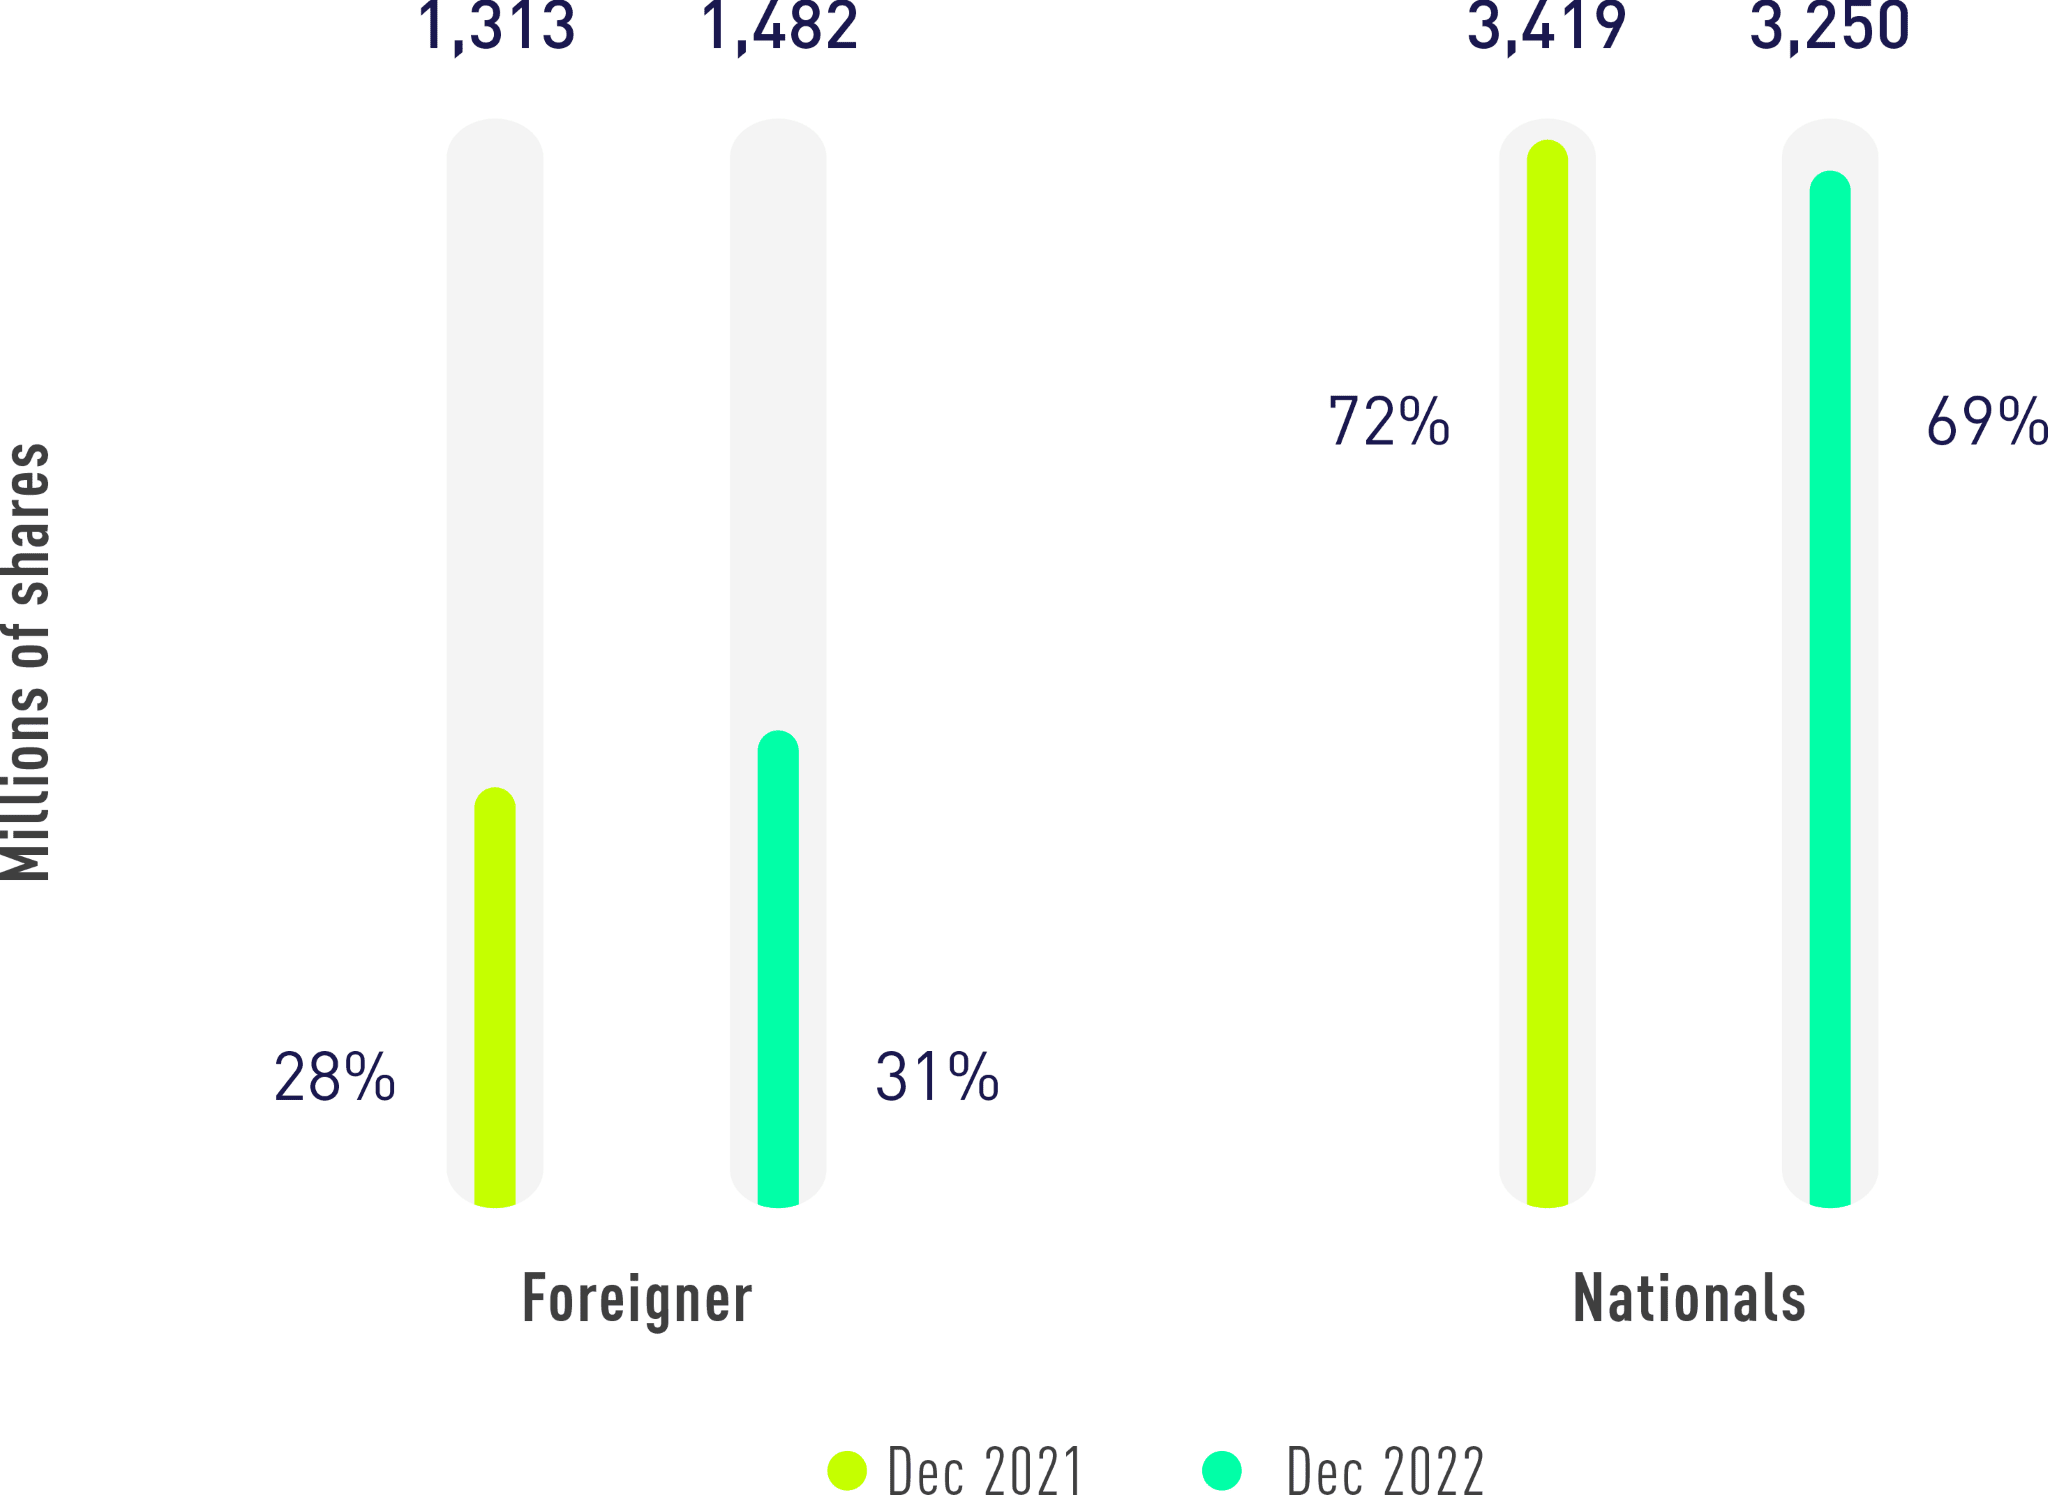
Ecopetrol’s shareholding composition as of December 31, 2022, highlights a 12.9% increase in the stake of foreign shareholders and an 8.7% drop in the stake of natural persons.

Identification of
the main shareholders
The twenty-five (25) shareholders with the largest number of Ecopetrol shares as of December 31, 2022 are listed below:
| N.º | Investor | N.º shares as of December 2022 | Stake |
|---|---|---|---|
| 1 | STATE ENTITIES | 36,385 | 88.49% |
| 2 | JPMORGAN CHASE BANK NA FBO HOLDERS OF DR ECOPETROL | 1,019 | 2.48% |
| 3 | ISHARES MSCI COLCAP STOCK FUND | 354 | 0.86% |
| 4 | PORVENIR HIGHER RISK MANDATORY PENSION FUND | 328 | 0.80% |
| 5 | PORVENIR MODERATE MANDATORY PENSION FUND | 312 | 0.76% |
| 6 | PROTECCIÓN MODERATE MANDATORY PENSION FUND | 288 | 0.70% |
| 7 | PROTECCIÓN HIGHER RISK MANDATORY PENSION FUND | 224 | 0.54% |
| 8 | COLFONDOS MODERATE MANDATORY PENSION FUND | 133 | 0.32% |
| 9 | NORGES BANK | 116 | 0.28% |
| 10 | COLFONDOS HIGHER RISK MANDATORY PENSION FUND | 84 | 0.20% |
| 11 | HORIZONS COLOMBIA SELECT DE S&P STOCK FUND | 84 | 0.20% |
| 12 | VANGUARD TOTAL INTERNATIONAL STOCK INDEX FUND | 64 | 0.16% |
| 13 | SKANDIA MODERATE MANDATORY PENSION FUND | 58 | 0.14% |
| 14 | JP MORGAN SECURITIES PLC | 57 | 0.14% |
| 15 | VANGUARD EMERGING MARKETS STOCK INDEX FUND | 44 | 0.11% |
| 16 | PROTECCIÓN RETIREMENT MANDATORY PENSION FUND | 43 | 0.11% |
| 17 | VOL-ECOPET PROTECCIÓN PENSION FUND | 41 | 0.10% |
| 18 | SKANDIA HIGHER RISK MANDATORY PENSION FUND | 39 | 0.09% |
| 19 | PORVENIR SEVERANCE FUND | 35 | 0.09% |
| 20 | ASHMORE AC + LATAM CLOSED COLLECT INVESTMENT FUND | 34 | 0.08% |
| 21 | PROTECCIÓN LONG-TERM SEVERANCE FUND | 32 | 0.08% |
| 22 | PORVENIR SPECIAL PLANNED RETIREMENT FUND | 32 | 0.08% |
| 23 | PORVENIR CONSERVATIVE MANDATORY PENSION FUND | 22 | 0.05% |
| 24 | COLFONDOS PLANNED RETIREMENT MANDATORY PENSION FUND | 21 | 0.05% |
| 25 | PROTECCIÓN CONSERVATIVE MANDATORY PENSION FUND | 19 | 0.05% |
In line with the Colombian Code of Best Corporate Practices5, no Ecopetrol shareholder, except for the Nation, individually owns a “significant stake” (equivalent to 10% or more of outstanding shares). By virtue of the authorized capitalization process, the Nation must retain, at least, eighty percent (80%) of outstanding shares with voting rights6.
Stock trading
In 2022, no Ecopetrol administrator requested authorization from the Board of Directors to sell Company shares.
Total capitalizationl
Table 6 shows the value of Ecopetrol’s market capitalization as of December 31, 2022.
| Number of shares | 41,116,694,690 |
| Share price as of December 31, 2022 (COP) | 2,420 |
| Market Capitalization (Colombian pesos COP) | 99,502,401,149,800 |
Share capital
A 31 de diciembre de 2022, el capital social de Ecopetrol no presentó variación respecto del año anterior.
| Capital autorizado Ecopetrol (COP) | 36,540,000,000,000* |
| Total acciones | 60,000,000,000 |
| Valor nominal (COP) | 609** |
* Equivalent to USD 7,596,357,740.
** Equivalent to USD 0.13.
This information was calculated with the TRM of December 31, 2022: COP 4,810.20
Ecopetrol’s shares are nominal, ordinary, grant their holder equal rights in the Company’s assets and benefits distributed, and each of them has the right to one vote in the deliberations of the General Shareholders’ Meeting, with the legal limitations applicable in each case (e.g., default by shareholders, among others). There are no treasury shares held by the Company.
5 Financial Superintendence of Colombia, External Circular n.º 028 of 2014.
6 Article 2, Law 1118 of 2006..

Shareholder and investor
service and communication
Ecopetrol provides equitable treatment to all shareholders, without prioritizing the interests of any over the others, considering that each shareholder has the same rights according to the class of shares they hold, and therefore, to guarantee the full exercise of the rights and a correct fulfillment of its obligations to its investors and shareholders, the Company addresses all petitions, claims, and requests for information in the same way, regardless of the value of the investment or the number of shares it represents.
In 2022, a total of 80,755 shareholder requests were received through all service channels and 99.51% of the various requirements were addressed in a timely manner. Also, no claims regarding compliance with the Code of Good Governance were filed by shareholders and investors.
A total of 13,137 satisfaction surveys were conducted on the service received by shareholders and investors.
The main shareholder loyalty activities conducted during 2022 are listed below:
Information Bulletin for Shareholders
Data update campaign using different customer service channels, with a total of 11,986 updated data points.
Participation in twelve international conferences with analysts and institutional investors.
Participation in the “Ecopetrol towards a TESG transformation” webinar organized by Casa de Bolsa Stock Brokerage Company, targeting minority shareholders and addressing critical issues and updates related to the Oil Sector and Ecopetrol.
“Semana del Emisor” (Issuer Week) took place using the Trii platform, an e-trading application associated with Acciones & Valores Stock Market Commissioner, where you can buy and sell shares of companies listed on the Colombian Stock Exchange and in the Colombian Global Market. Talks on the Company’s financial results, its TESG strategy, and progress made in the 2040 Strategy were given to minority shareholders during the week. In addition, a commission-free day was granted on transactions with Ecopetrol shares, closing the day with a record of 4,525 operations on the platform.
Ecopetrol’s visit to Medellín, Barranquilla, and Duitama with financial education talks for minority shareholders given by the Colombian Stock Exchange, together with the participation of some stock brokerage firms to provide information and conduct data updating processes.
Ecopetrol has been awarded the IR recognition (Investor Relations) by the Colombian Stock Exchange, which highlights the Company’s commitment to best practices in the disclosure of information and investor relations. Visit
for more information.
Financial assistance
received from the government
Current tax regulations do not provide for tax deductions that can be used by the Company. On the other hand, the same tax regulations provide for tax credits that can be used by the Company in determining its income tax. As of December 31, 2022, Ecopetrol has 860 BCOP in tax credits, which will be used to determine the income tax payable in 2023.
On the other hand, no financial assistance was received from Export Credit Agencies (ECAs) in 2022.
Transfers to the Nation
Ecopetrol is one of the largest national and territorial taxpayers in Colombia. Its tax policy seeks to comply with its legal obligations under current regulations and obtain the highest tax benefits for the Company. The taxes payable by Ecopetrol are summarized in the table below.
| Tax type | Impuesto |
|---|---|
| National |
|
| Territorial |
|
The amount paid by Ecopetrol includes the taxes payable by the Company and the tax withholdings or collections applied to third parties and transfers to the different tax authorities in its capacity as withholding agent. Ecopetrol’s individual and consolidated effective tax rate in 2022 was 33.8% and 31.4%, respectively.
by Ecopetrol
| TAX TYPE | 2018 | 2019 | 2020 | 2021 | 2022 | PURPOSE |
|---|---|---|---|---|---|---|
| OWN TAXES | ||||||
| Income tax | 272,763 | – | 446,316 | – | 69,530 | Nation |
| Self-withholding for equity – CREE | – | – | – | – | – | Nation |
| Income self-withholding | 5,094,734 | 2,172,632 | 1,728,724 | 2,795,957 | 5,196,462 | Nation |
| Equity/Wealth Tax (valid until 2017) | – | – | – | – | – | Nation |
| National gasoline and Diesel (ACPM) tax | 45 | 45 | 31 | 30 | 30 | Nation |
| Carbon tax (effective as of 2017) | 619 | 1,128 | 446 | 800 | 146 | Nation |
| National Diesel (ACPM) surcharge | 29 | 26 | 18 | 16 | 16 | Nation |
| Sales tax | 765,949 | 756,350 | – | – | – | Nation |
| Industry and commerce tax | 136,012 | 167,124 | 165,289 | 149,353 | 312,817 | Municipalities |
| Property tax | 22,641 | 22,439 | 20,763 | 21,184 | 46,054 | Municipalities |
| Transport tax | 73,786 | 77,267 | 163,553 | 166,936 | 401,210 | Municipalities |
| Tax on financial transactions | 137,975 | 142,312 | 128,230 | 135,793 | 296,154 | Nation |
| Vehicle tax | 239 | 173 | 92 | 95 | 227 | Municipalities |
| Lighting tax | 10,590 | 11,646 | 19,374 | 40,534 | 62,620 | Municipalities |
| Gasoline surcharge | 6 | 5 | 2 | 2 | 3 | Departments/Municipalities |
| SUBTOTAL OWN TAXES | 6,515,388 | 3,351,147 | 2,672,838 | 3,310,699 | 6,385,269 | |
| THIRD PARTY COLLECTION | ||||||
| National gasoline and Diesel (ACPM) tax | 983,425 | 1,188,018 | 954,854 | 1,303,416 | 1,499,890 | Nation |
| Income/VAT/stamp withholding tax | 985,174 | 1,060,373 | 1,175,564 | 1,328,934 | 1,854,695 | Nation |
| National pro-university stamp | – | 3,132 | 675 | 2,063 | 17,293 | Ministry of Education / Nation |
| Construction contribution (effective as of 2020) | – | – | 688 | 14,942 | 100,088 | Ministry of Interior |
| COVID-19 solidarity tax withholdings | – | – | 45,216 | – | – | Nation |
| National Diesel (ACPM) surcharge | 49,658 | 50,870 | 31,594 | 26,690 | 27,183 | Nation |
| Carbon tax (effective as of 2017) | 224,730 | 363,930 | 235,123 | 264,210 | 341,462 | Nation |
| Industry and commerce withholding tax | 46,791 | 68,940 | 77,870 | 230,873 | 108,057 | Municipalities |
| SUBTOTAL TAX COLLECTION FROM THIRD PARTIES | 2,289,778 | 2,735,263 | 2,521,583 | 3,171,128 | 3,948,668 | |
| TOTAL | 8,805,166 | 6,086,410 | 5,194,421 | 6,481,827 | 10,333,937 | |
The Ecopetrol Group’s contribution to the Nation in 2022 represented transfers effectively paid in the amount of 42.4 TRILLION COP as follows: dividends 16.3 TRILLION COP, total taxes 16.4 TRILLION COP (includes taxes paid by the Company and tax withholdings or collections applied on third parties and transferred to the different tax authorities in its capacity as withholding agent), and royalties and purchases of crude oil and gas from the ANH in the amount of 9.7 TRILLION COP.
Tax-related issuess
The document containing the Ecopetrol Group’s Tax Policy is published on the Ecopetrol website at the following link. The main topics covered are:
01
Timely compliance with all national and international tax obligations based on current legislation.
02
The Ecopetrol Group’s strategy is not focused on adopting aggressive or risky tax decisions that could question its tax returns.
03
The Boards of Directors of Ecopetrol and of the different Group companies will be informed of the main tax implications arising from their operations or of all matters subject to their approval, particularly when they constitute a relevant decision-making factor.
04
In order to optimize the tax treatment of the different operations, the rules set forth in the agreements shall apply to avoid double taxation, if any.
Good Tax Practices
Documentation and standardization of the Group’s tax planning.
A transfer pricing guide is available to guarantee that the operations, agreements, and/or contracts entered into between the affiliates and subsidiaries of the Ecopetrol Group are carried out under market conditions, avoiding the erosion of tax bases.
Not using structures or the intermediation of instrumental companies through tax havens or territories that do not cooperate with tax authorities, without a real or valid business reason.
Monitoring and Control
Updating, publishing, and sharing the tax planning memorandum with all Group companies every time the National Government enacts a regulation that affects its guidelines.
Holding quarterly committees with the Group to review the implementation of benefits and update on tax issues.
Reporting relevant aspects such as the behavior of the effective tax rate, relevant transactions that affected it, a comparative table with data from the immediately previous period, the effect of the last tax reform on the group’s rate, among other matters.

Main aspects of Ecopetrol’s tax planning
Using the tax benefits contemplated under current regulations:
- Law 2277 of 2022 did not introduce any modification to the existing reduction of the presumptive income rate to zero (0) since 2021.
- VAT discount on the acquisition, construction, etc., of Productive Real Fixed Assets.
- Deduction of 100% of the ICA (Industry and Commerce Tax) effectively paid throughout the year.
- Tax benefits for using alternative energies.
- Optimizing the benefit of carbon credits.
- Discount of Article 256 of the Tax Code for investments in science, technological development, and innovation.
- Others.
- Involvement in the structuring and tax definition of the Group’s new businesses.
- Notification of changes in the tax legislation to the different areas of the Company and its subsidiaries.
- Teamwork with the Ministry of Finance and Public Credit (MHCP), the Ministry of Mines and Energy (MME), and the National Tax and Customs Authority (DIAN).
- Creation of Tax Committees in the Ecopetrol Group and quarterly litigation reports pertaining to all Group companies.
Tax Risks
Ecopetrol has identified some tax risks that could cause business losses, if materialized, as well as the payment of penalties and default interest to the tax authority.
The main risks are:
- Changes in the tax legislation of the countries in which the Company currently operates.
- Adopting aggressive tax positions that may lead to disputes with the tax authority.
- Changes in the existing tax doctrine that give rise to disputes with the tax authority.
The Company’s risk matrix and the procedure to assess the economic impact associated with the occurrence of risks is published at
III.4. About Ecopetrol’s Operations
III.4.1. Hydrocarbon Business Line
Exploration
It is the first link in Ecopetrol’s value chain in the hydrocarbons business line, and its main objective is to discover and delimit commercially viable accumulations of hydrocarbons to ensure the expansion of the reserves required for the sustainability of the Group. High technical assurance standards are maintained to this end, optimizing the management of the prospects and discoveries portfolio, steering efforts in compliance with the exploratory strategy, and streamlining the maturation process of opportunities, as well as their conversion into discovered, contingent, and reserve resources.
Production and Development
The second link in the value chain includes the production of crude oil, gas, and white products, either directly or in partnership with other companies. Its main objective is the extraction of hydrocarbons via optimal development of the fields.
Exploration and Production Strategy
This segment’s strategy seeks to grow with the energy transition, decarbonizing operations and strengthening the gas portfolio, focusing on sustainable value creation for Stakeholders and preserving competitive returns for the Company.
For the materialization of the strategy, which projects between 700-750 kboed of hydrocarbon production by 2040, with a peak of 800-850 kboed by 2030 at high price levels, Ecopetrol has designed several lines of action, including activities in existing conventional assets and in other geographies, exploration in the Caribe offshore and in the Colombian onshore, and international as well as new business opportunities.
More specifically, the exploration and production strategy focuses on:
- High competitiveness and resilience:
focusing on material opportunities with competitive equilibrium prices and renouncing unprofitable opportunities. - Quick trading:
concentrating efforts on gas and light hydrocarbon opportunities near existing fields, in line with the near field exploration strategy, and with an optimal start in the incorporation of reserves and production. - Hydrocarbons favorable to the energy transition:
greater emphasis on light crude oil and gas projects to ensure a emission reduction from new opportunities and expanding the gas share in the product portfolio. - Low execution risk:
focusing on opportunities with a high probability of execution, as well as ensuring risk mitigation actions for opportunities with high strategic value, but low probability of materializing. - Development of the Caño Sur and Akacías green fields.
- Value maximization in the recovery program, mainly in heavy crude oil and in the Magdalena Medio region.
- Protecting the basic curve, mitigating the natural decline of the fields and continuing with primary recovery, mainly in Rubiales.
As of June 2022, with the purpose of responding to the Ecopetrol Group’s 2040 Strategy: Energy that Transforms, and more specifically, to the Growing with the Energy Transition pillar, a new operating model was approved for the upstream (exploration and production) to guarantee a comprehensive perspective of the segment, provide greater autonomy to the regions, and for better integration and synergy with the subsidiaries.
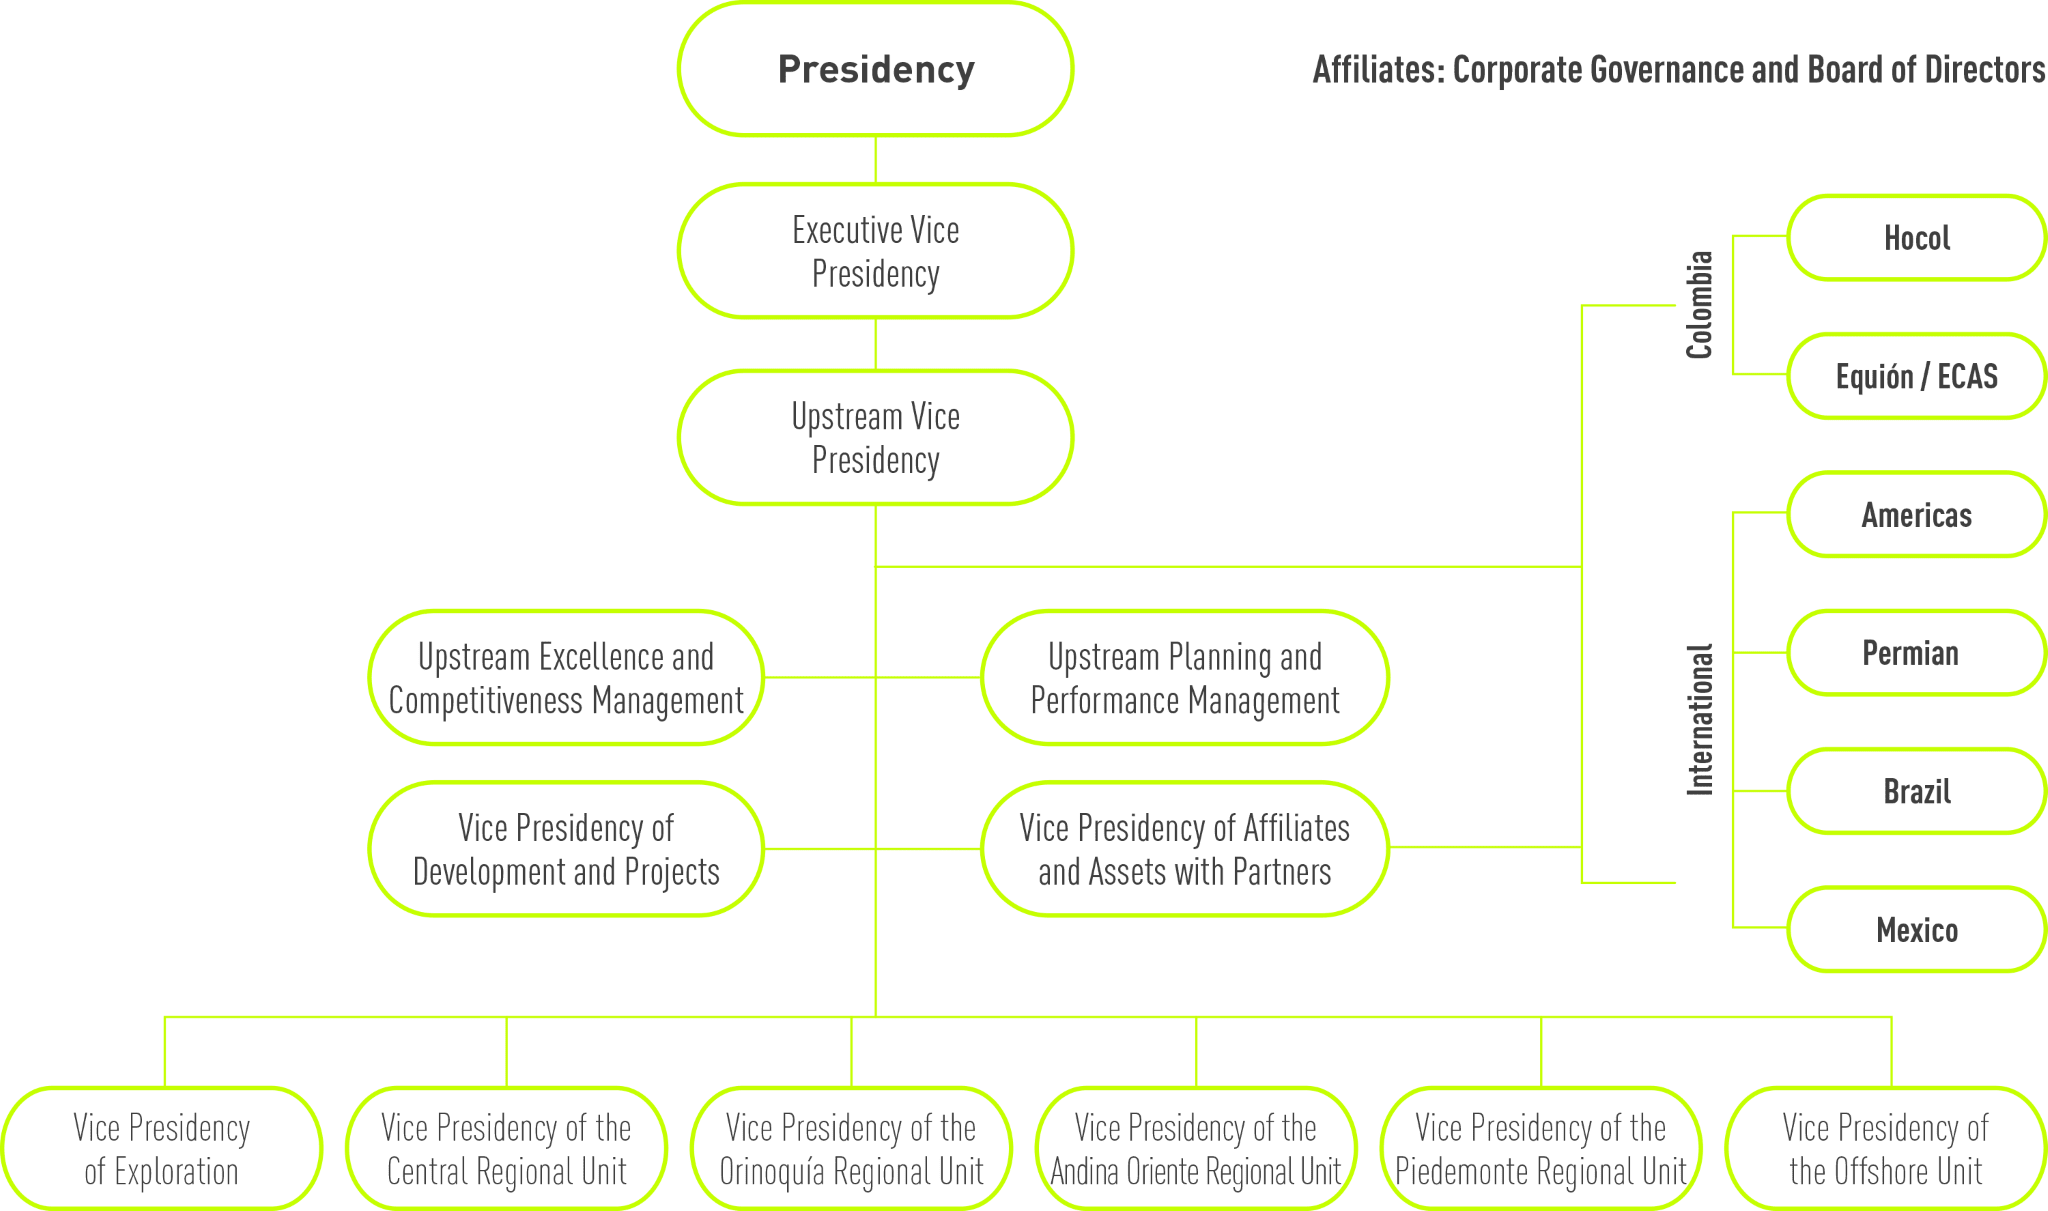
The new organization committed itself to the main objectives:
1
Achieve an accelerated and efficient maturation of opportunities to reach the market more quickly.
2
Fortalecer una visión integrada de la cadena de valor mediante una mejor integración y coordinación de las áreas del segmento.
3
Define a more efficient engagement mechanism with subsidiaries and partners to align objectives and exchange knowledge.

Exploratory Activity
Exploratory Drilling
Ecopetrol and its partners drilled 24 exploratory wells, in line with the proposed plan (23 in Colombia and 1 in the Gulf of Mexico), with seven (7) exploratory successes in basins of great interest to the Company, which will contribute to the country’s energy sovereignty: the Colombian offshore (Uchuva-1, Gorgon-2), Valle Superior del Magdalena (El Niño-2 and Ibamaca-2ST delimiter, confirming discovery announced in January 2022), Valle Medio del Magdalena (Morito-1), Llanos Orientales (Tejón-1), and Valle Inferior del Magdalena (Coralino-1).
| N.º | Well | Operator / Partner | Contract / Block | Results |
|---|---|---|---|---|
| 1 | El Niño-2 | Perenco 30% (operator), Ecopetrol 50%, CNOOC 20% | Boquerón | Successful |
| 2 | Tejon-1 | Ecopetrol 55% (operator) – Repsol 45% | CPO-9 | Successful |
| 3 | Morito-1 | Ecopetrol 100% (operator) | Magdalena Medio Exploitation Agreement | Successful |
| 4 | Gorgon-2 | Ecopetrol 50% Shell 50% (operator) | COL-5 | Successful |
| 5 | Uchuva-1 | Petrobras 44.44% (operator) Ecopetrol 55.56% | Tayrona | Successful |
| 6 | Coralino-1 | Hocol 100% (operator) | VIM-8 | Successful |
| 7 | Ibamaca-2 ST | Hocol 100% (operator) | Tolima | Successful |
| 8 | Guarapo-1 ST1 | Parex 80% (operator) ECP 20% | Fortuna | Under evaluation |
| 9 | Yoda A-1 | Hocol 100% (operator) | YDSN-1 | Under evaluation |
| 10 | Arrecife Norte-1 | Hocol 100% (operator) | VIM-8 | Under evaluation |
| 11 | Alqamari-2 | Ecopetrol 100% (operator) | Western Putumayo | Under evaluation |
| 12 | Tororoi-1 | Hocol 50% Geopark 50% (operator) | LLA-87 | Under evaluation |
| 13 | Tinamú-1 | Repsol (45%) Ecopetrol 55% (operator) | CPO 9 | Under evaluation |
| 14 | EST SN 15 | Hocol 100% (operator) | SN15 | Stratigraphic |
| 15 | Bololó-1 | Hocol 100% (operator) | VIM-8 | Dry |
| 16 | Pilonera-1 | Hocol 50% Lewis Energy 50% (operator) | SSJN1 | Dry |
| 17 | Boranda Sur-3 | Parex 50% (operator) Ecopetrol 50% | Boranda | Dry |
| 18 | Chinchorro-1 G | Hocol 100% (operator) | GUA-2 | Dry |
| 19 | Boranda Norte-1 | Parex 50% (operator) ECP 50% | Boranda | Dry |
| 20 | Kinacú-1 | Ecopetrol 100% (operator) | South Area | Dry |
| 21 | Starman-1 | Chevron 50% (operator) EAI 25% BHP 25% | MC412–USGoM | Dry |
| 22 | Yoda B-1 | Hocol 100% (operator) | YDSN-1 | Dry |
| 23 | Sinuano-1 | Hocol 100% (operator) | SN-8 | Dry |
| 24 | Ibamaca-2 | Hocol 100% (operator) | Tolima | Dry |
Advancements in the gas portfolio
Progress was made in 2022 in the evaluation of the Gorgon-2 and Uchuva-1 discoveries in the Colombian offshore to define the delimitation and development plan for these discoveries. On the Piedemonte Llanero, the Cupiagua XD 45 and Cusiana V31 exploratory wells were being drilled by the end of the year, in order to find new gas and light hydrocarbon accumulations in the vicinity of existing fields, in line with the Near Field Exploration strategy.
In turn, Hocol undertook exploratory activities in the areas of northern Colombia, with the successful drilling of the Coralino-1 well, confirming the presence of gas in the Ciénaga de Oro formation.
Seismic Information
In order to strengthen the exploratory areas already awarded, progress was made in the acquisition of national seismic information with the Flamencos 3D program operated by Ecopetrol and the SSJN1 2D program operated by Hocol, which are in the operating stage and are expected to complete registration in 2023.
Moreover, Ecopetrol acquired 2,639 km2 of 3D seismic information (4,486 equivalent km) in Llanos Orientales to expand the technical knowledge on this prolific basin. Similarly, Hocol acquired 472 km of 2D information and 923 km2 of 3D information (2,041 equivalent km) on different areas of interest, from the Llanos basin to northern Colombia. Ecopetrol Brasil acquired 2,595 km2 of 3D information on the Santos basin (4,412 equivalent km).


From 2017 to 2021, around 44,917 equivalent km of seismic information in the onshore and offshore basins of Colombia have been reprocessed and reinterpreted by the Ecopetrol Group, which has contributed to the reduction of uncertainty by improving the seismic image. This has leveraged interpretation to support the characterization of exploratory opportunities, in periods in which seismic acquisition has been complicated due to environmental restrictions and/or reduced investments because of crude oil prices.
During 2022, Ecopetrol S.A. and its subsidiary Hocol reprocessed and reinterpreted 12,101 equivalent km and 1,006 equivalent km of seismic information, respectively, in offshore areas of great relevance such as Piedemonte, Putumayo, northern Colombia, and Valle Medio and Valle Superior del Magdalena, allowing the continued identification, evaluation, and maturation of new opportunities.
Contracts and Exploratory Areas
By the end of 2022, Ecopetrol had 109 exploratory assets, distributed as follows:
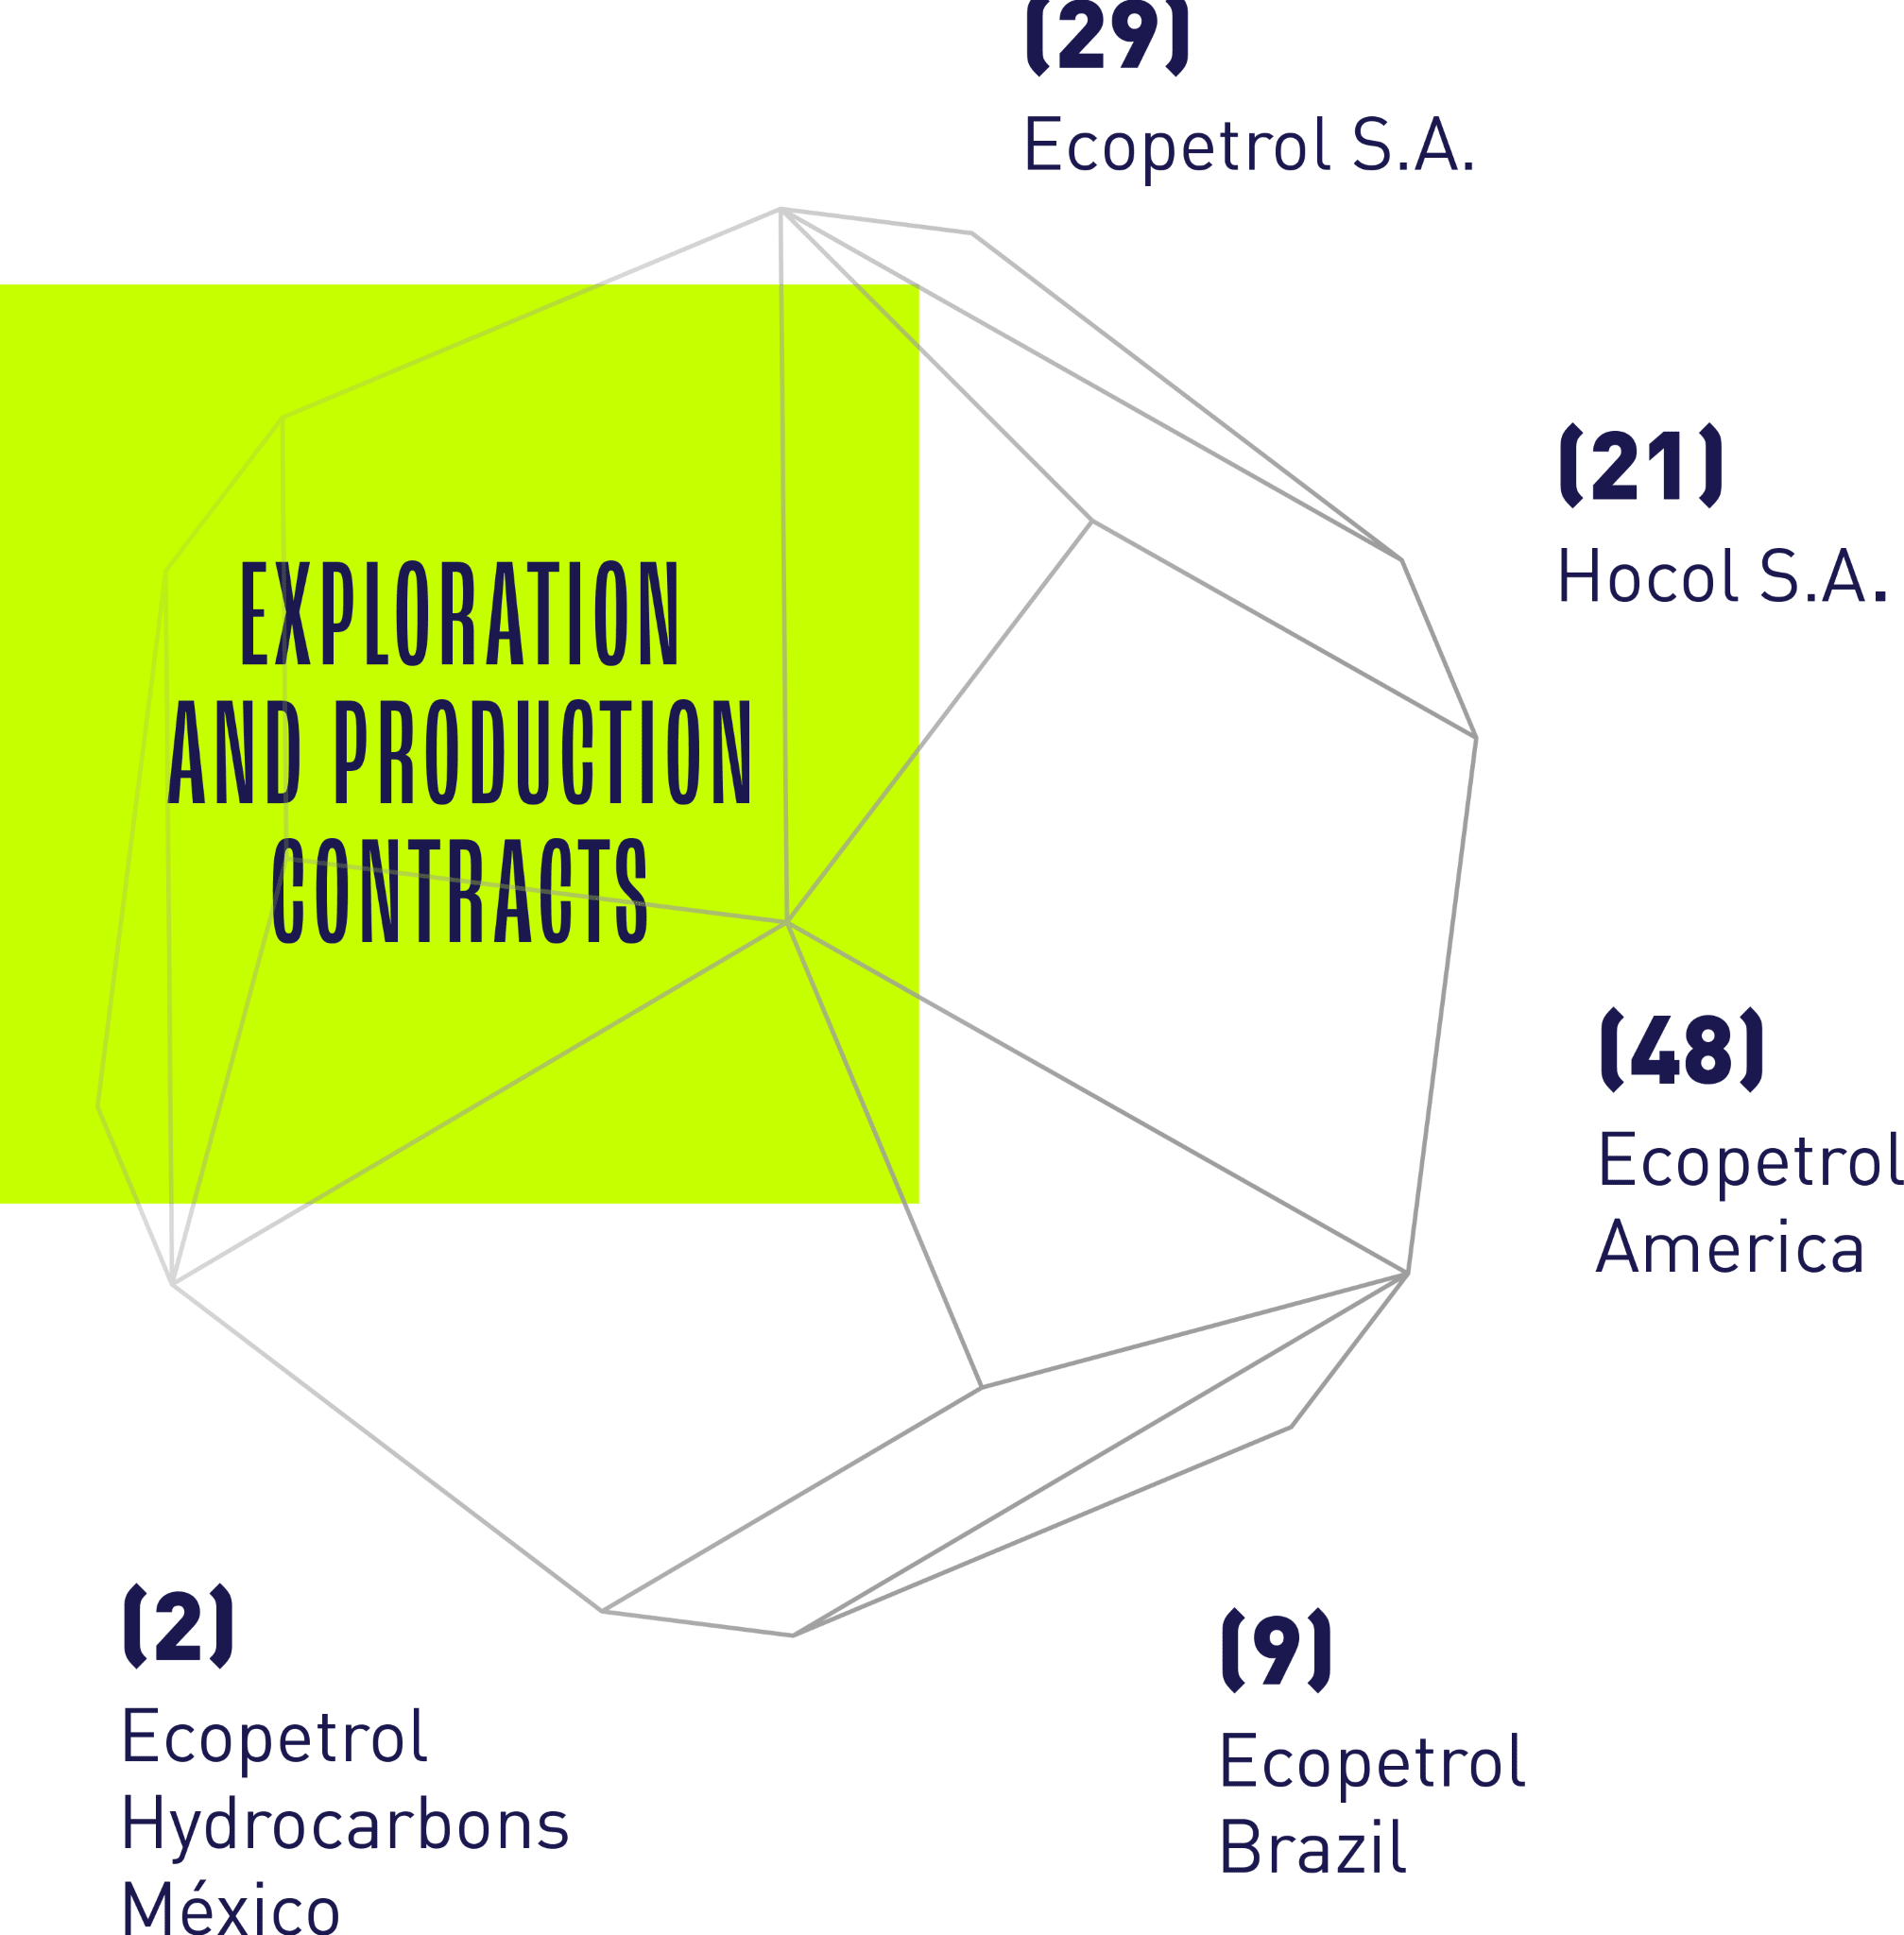
Some of these contracts have operating or non-operating partners.
| PARTNERSHIP | CONCESSION | E&P CONTRACT | CET*** | E&P AGREEMENT | CRC** | PSC* | Royalty/Tax Agreement | |
|---|---|---|---|---|---|---|---|---|
| MEXICO | 2 | |||||||
| BRAZIL | 7 | 2 | ||||||
| HOCOL | 1 | 19 | 1 | |||||
| ECOPETROL | 3 | 21 | 3 | 1 | 1 | |||
| EA | 48 |
Note:
*PSC: Production Sharing Agreement
**CRC: Shared Risk Contract
***CET: Technical Evaluation Contract
EA: Ecopetrol América (Gulf of Mexico)
Five (5) assets were in the divestment process at the end of 2022:
Also, exploratory opportunities have been identified in 30 production area assets that are part of the portfolio of projects in maturation (24 Ecopetrol S.A. and 6 Hocol).
The 109 exploratory assets cover a total of 7.19 billion hectares, distributed in the different subsidiaries and areas of exploratory interest: Colombia, Brazil, USA, and Mexico.

Production and Development
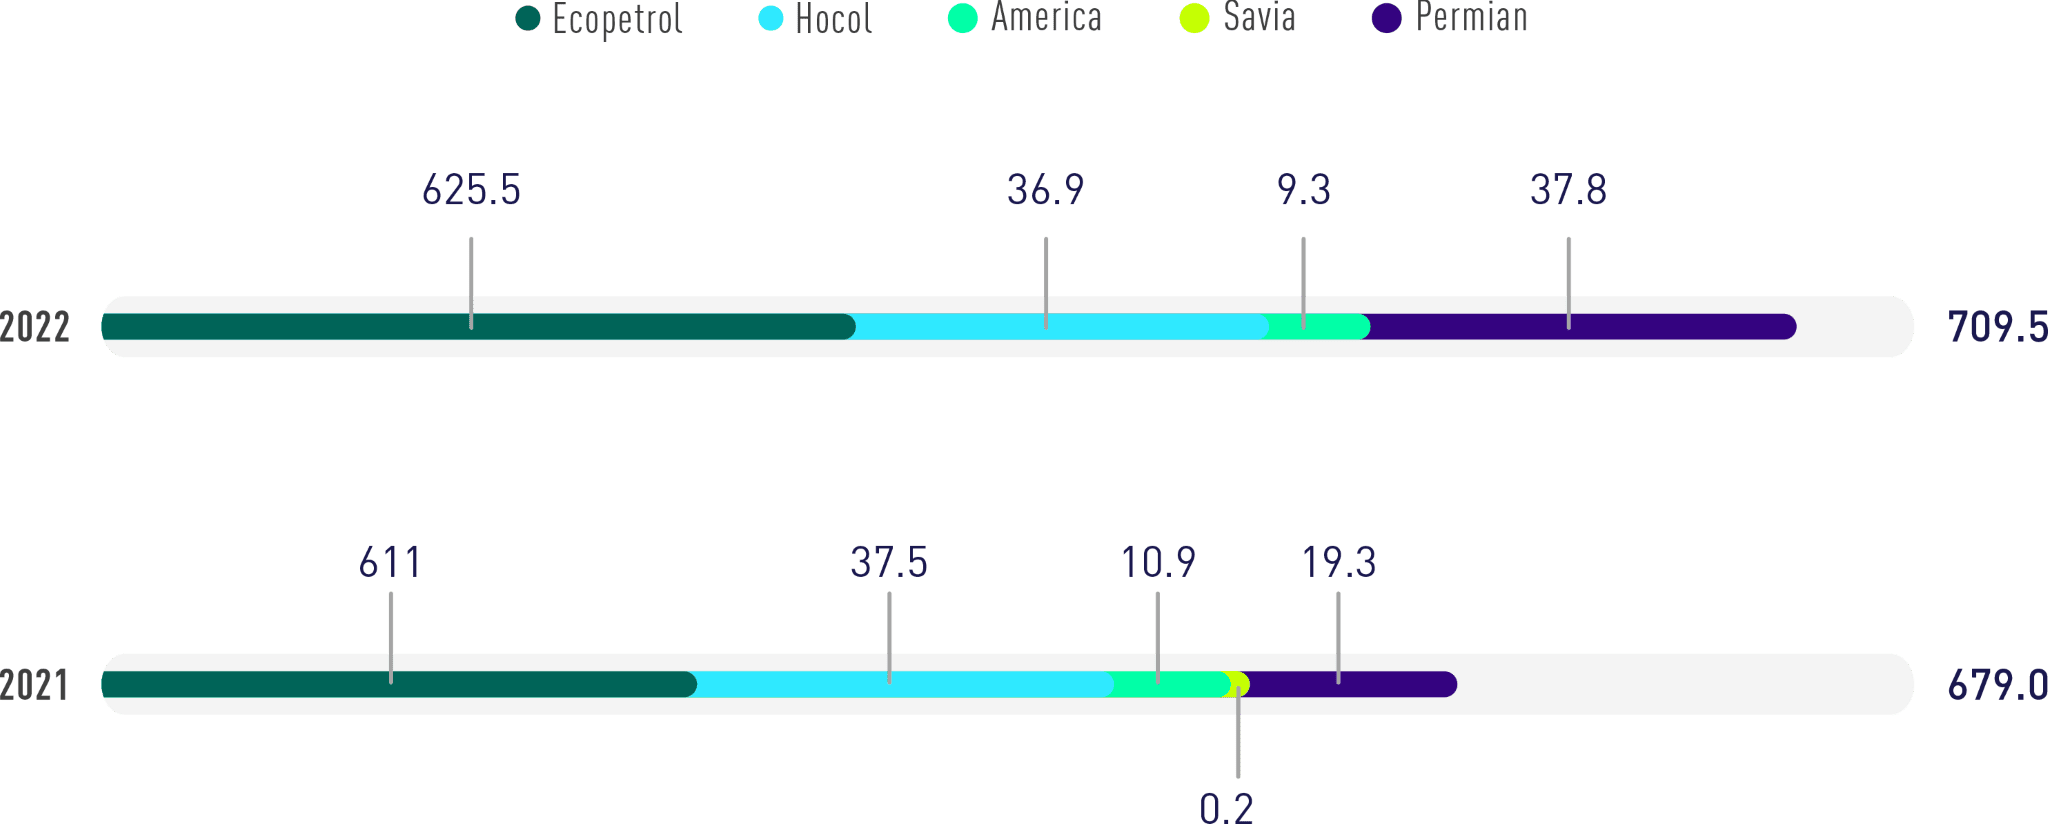
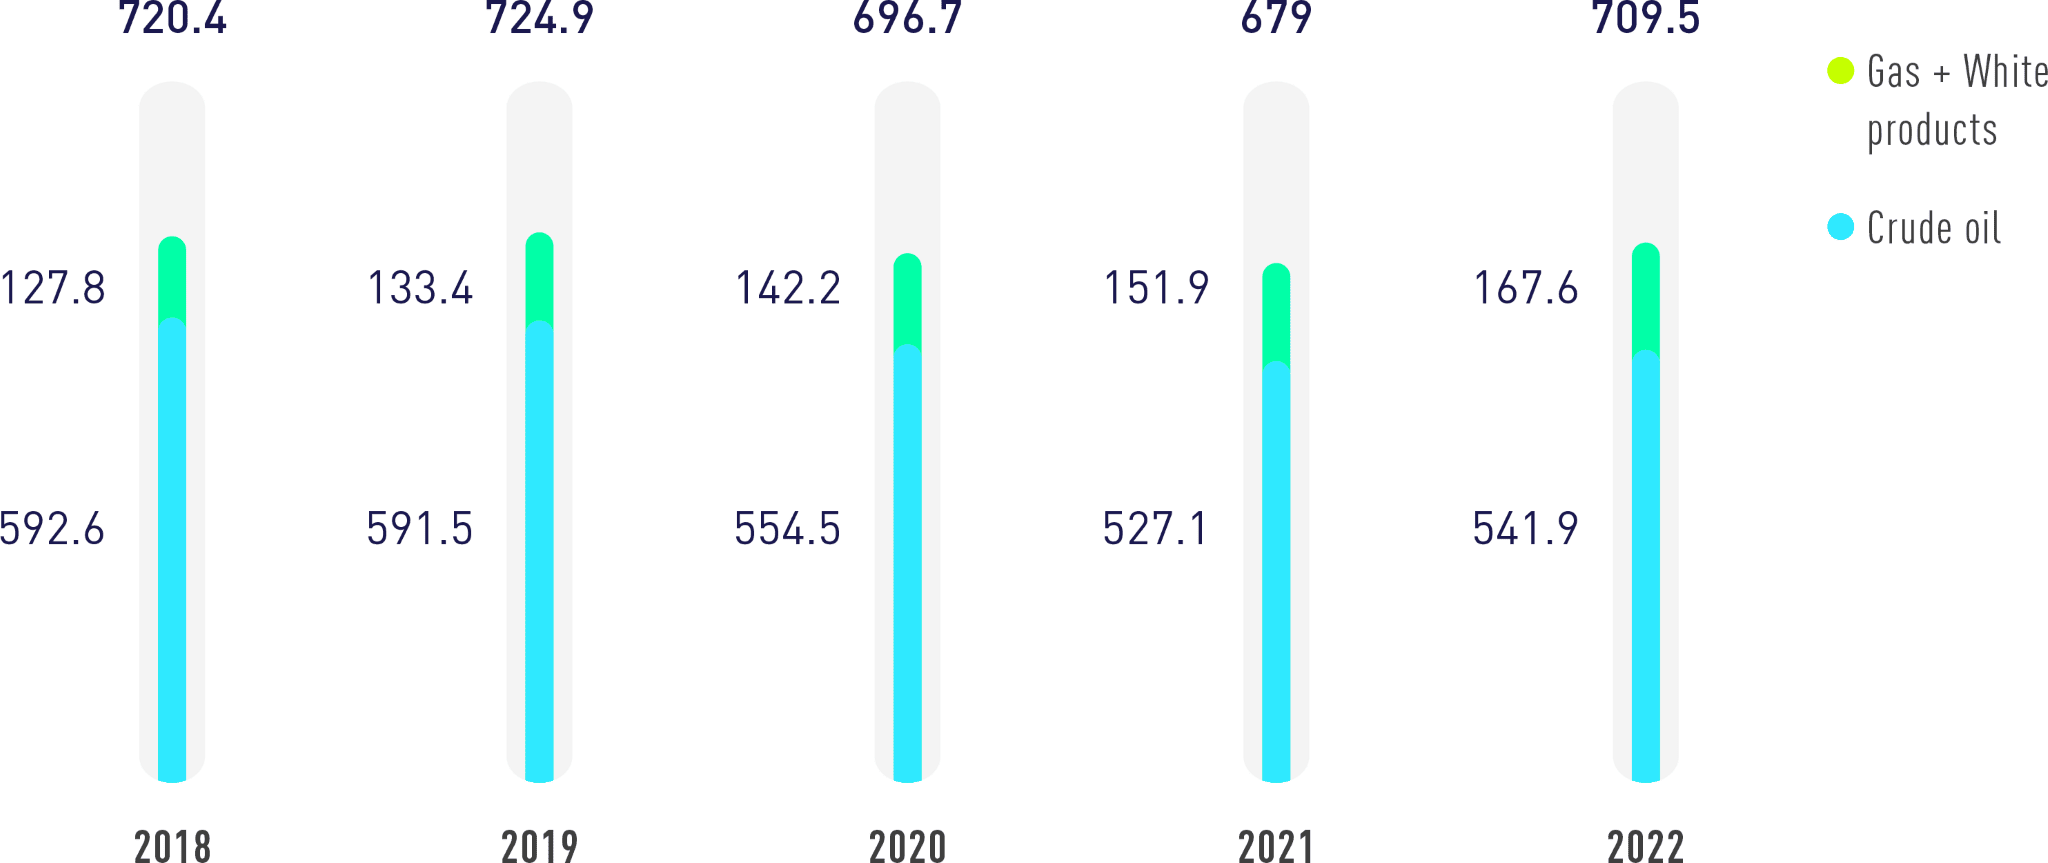
In 2022, the Ecopetrol Group’s production accounted for 709.5 thousand barrels of oil equivalent per day (kboed), of which 625.5 kboed were contributed by Ecopetrol and 84.0 kboed by the subsidiaries. Gas contribution represented 20% (139.6 kboed). The fields with recovery technologies contributed 40% of the Ecopetrol Group’s production.
Compared to the period of 2021, there was an increase of 30.5 kboed (14.4 kboed from Ecopetrol and 16.1 kboed from the subsidiaries), mainly due to the following factors: the incremental production of the Caño Sur and Permian assets, the reversal of the Nare partnership contract, and the management of the deposits in Chichimene, Akacías, and Rubiales, which resulted in lower water cuts, greater stakes in production due to the high prices in partnership operations, the restoration of production affected by public security events, and the lifting of operating restrictions in Castilla related to water management.
For the time being, Ecopetrol’s portfolio does account for, nor does it contemplate exploration and exploitation operations in the arctic region or the production of tar sands.
In accordance with the Guide for the Ecopetrol Group’s Corporate Governance Model (GEE-G-041), Ecopetrol participates as a shareholder in various companies, in order to add to the results of the business and the sustainability, strategic alignment, and optimization of the investment portfolio via the financial return generated by said companies.
In the case of the segments under the hydrocarbon business line and, particularly, the upstream segment, the necessary strategic alignment to articulate value generation efforts as a group is achieved through:
- i) The function of the upstream segment’s Vice President.
- ii) The Boards of Directors of the companies that make up the segment.
- iii) The execution of activities foreseen in the Group’s engagement mode

International Portfolio
The upstream has four (4) international subsidiaries in the United States, Mexico, and Brazil.
United States:
Permian:
- The Company has operations in the Permian, the most prolific basin in the world, with a first-tier operator (OXY). It has approximately 100,000 acres of low exploration risk, with no license expiration, and the operation unfolds in a stable regulatory framework.
- The business is characterized by:
- i) Increased production and materialization of reserves.
- ii) Agile and low-cost operations.
- iii) Short paybacks on annual campaigns (2-3 years).
- iv) Cash generation.
- The volumes produced are light (40 degrees API), which contributes to the diversification of the Group’s portfolio in the context of low CO2 emissions and water management.
- Below are some of the highlights of 2022:
- Zero recordable HSE events.
- Record production in October of 57.4 kboed (Ecopetrol’s production stake before royalties).
- The successful drilling of 103 development wells, with time and cost efficiency.
- In terms of TESG, low intensity of CO2 emissions < 8kgCO2e/boe can be highlighted, in addition to the recycling of more than 11 Mbls of water, equivalent to 40% of the production.
Ecopetrol America
- The deepwater exploration strategy in the Gulf of Mexico (USGoM) is focused mainly on the search and development of opportunities in the plays of Mioceno and Jurásico, prioritizing opportunities of low exploratory risk and that are close to existing infrastructure.
- It leverages geographic diversification and has access to high-quality reserves with top-tier operators such as Murphy, Hess, Oxy, and Quarter-North.
- It is the learning platform for strengthening deep-water exploration and production skills, and in terms of production, it offers access to barrels of medium and light crude oil in a low CO2 emissions environment.
- Below are some of the highlights of 2022:
- Well-related work was completed successfully in the Gunflint field, allowing EA production to recover by roughly 3.7 net kboed.
- Successful drilling of a new DC90 development well at Dalmatian, which will add to production by 2024 once completed.
Mexico
- The variables used to define Mexico’s strategy in 2019 show a negative trend to date, which is why this subsidiary is in the process of simplification (geographical exit).
- It is therefore worth noting that:
- i) No changes are expected to improve the opening conditions for the hydrocarbon business.
- ii) The current portfolio has limited prospects due to negative results in Block 6 and high risks in Block 8.
- iii) The country’s risk level has increased (e.g. limitation of import contracts and restrictions on crude oil export permits).
- In 2022, the National Hydrocarbons Commission (CNH) approved the assignment of the Block 8 contract to PEMEX. With regard to Block 6, the withdrawal from the block was filed and the completion of the process is expected for the third quarter of 2023.
Brazil
- Its activity focuses on offshore, with the strategic purpose of contributing to the internationalization of Ecopetrol via:
- i) The maturation of exploratory options in deep waters.
- ii) The acquisition of knowledge by developing offshore assets.
- iii) The incorporation of reserves in areas of high prospectivity.
- The Gato do Mato project is currently in maturation, with Ecopetrol holding a 30% stake, Shell (operator) 50%, and Total 20%.
- The Company’s Regional positioning was strengthened in 2022, thanks to the incorporation of six (6) new offshore exploratory blocks in the post-salt play of the Santos Sur basin.
National Subsidiaries
Hocol
- This subsidiary is intended to leverage growth, mainly in gas, as well as the Ecopetrol Group’s strategy in Colombia, with a differentiated and low-cost operating model.
- It has a high exploratory capacity with more than 70% of current production originating from discoveries in the last 15 years.
- Below are some of the highlights of 2022:
- The successful drilling of the Coralino-1 well in Córdoba, with a contribution of 2.77 MBOE of discovered resources yet to be delimited.
- Reduction of 14,102 TonCO2e (Scope 1 and 2) with the execution of 11 projects to reduce flaring and increase energy efficiency.
- Inauguration of the La Guajira Innovation and Entrepreneurship Center, leveraging the growth of a key region for the energy transition.
Well Drillings
In 2022, 536 development wells were drilled and completed: 250 from Ecopetrol’s direct operation, 162 were executed jointly with partners, 21 by Hocol and 103 by Permian, as shown in the table below:
| Company | 2021 | 2022 |
|---|---|---|
| Ecopetrol Direct Operation | 193 | 250 |
| Ecopetrol Operation with Partners | 95 | 162 |
| Hocol | 22 | 21 |
| Permian | 85 | 103 |
| Total Development Wells of the Business Group | 395 | 536 |
Number of maritime facilities: 2
(SASB EM-EP-000.C)Number of land facilities: 156
Inversiones upstream Grupo Ecopetrol
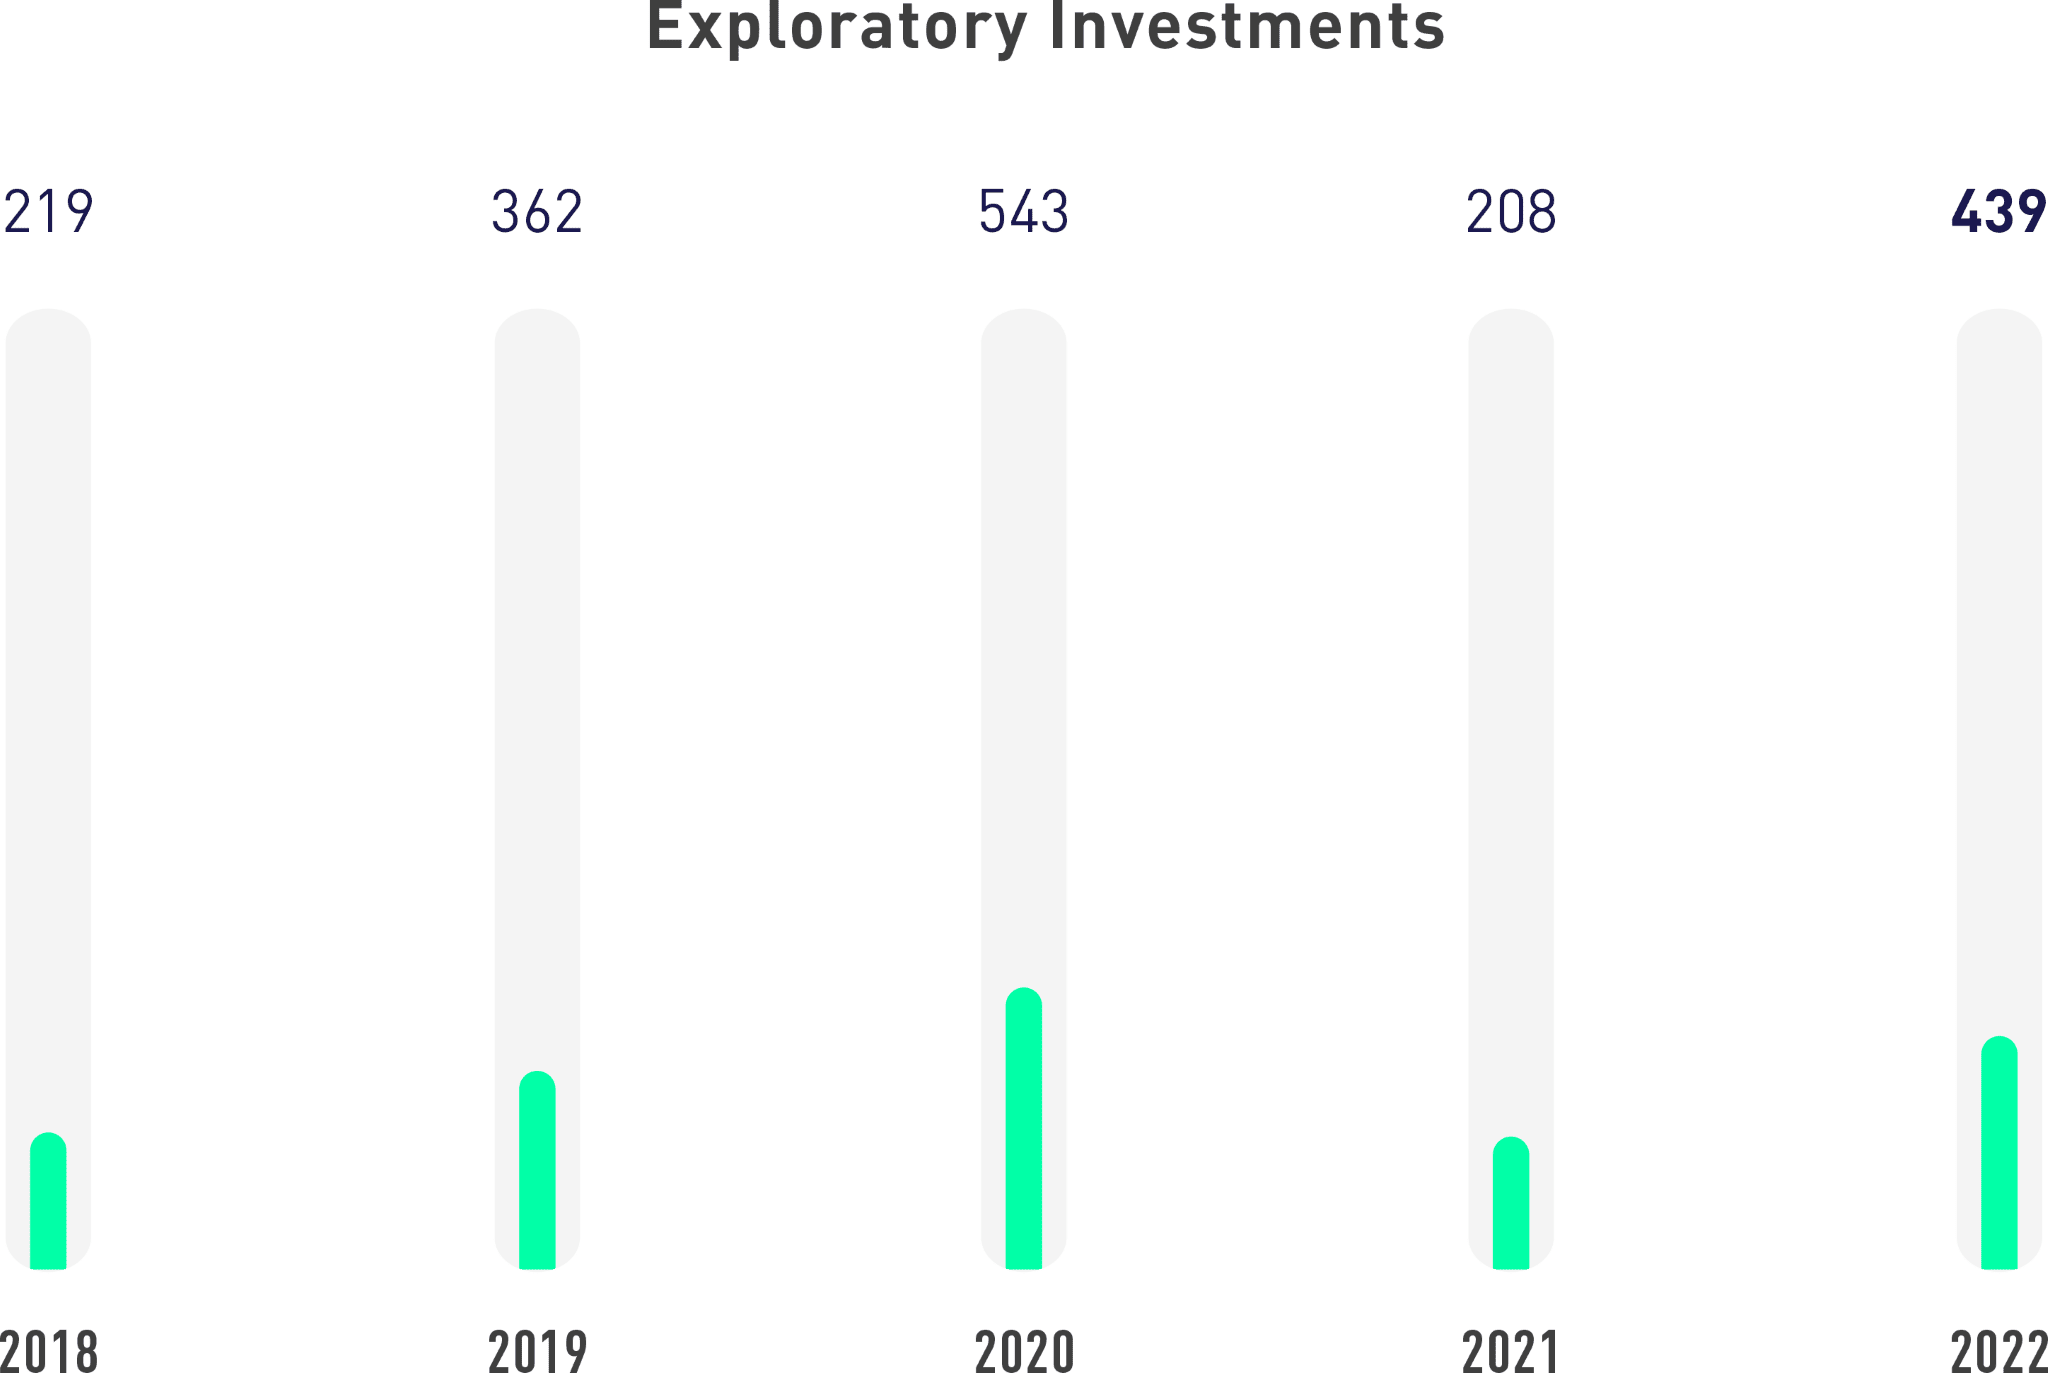
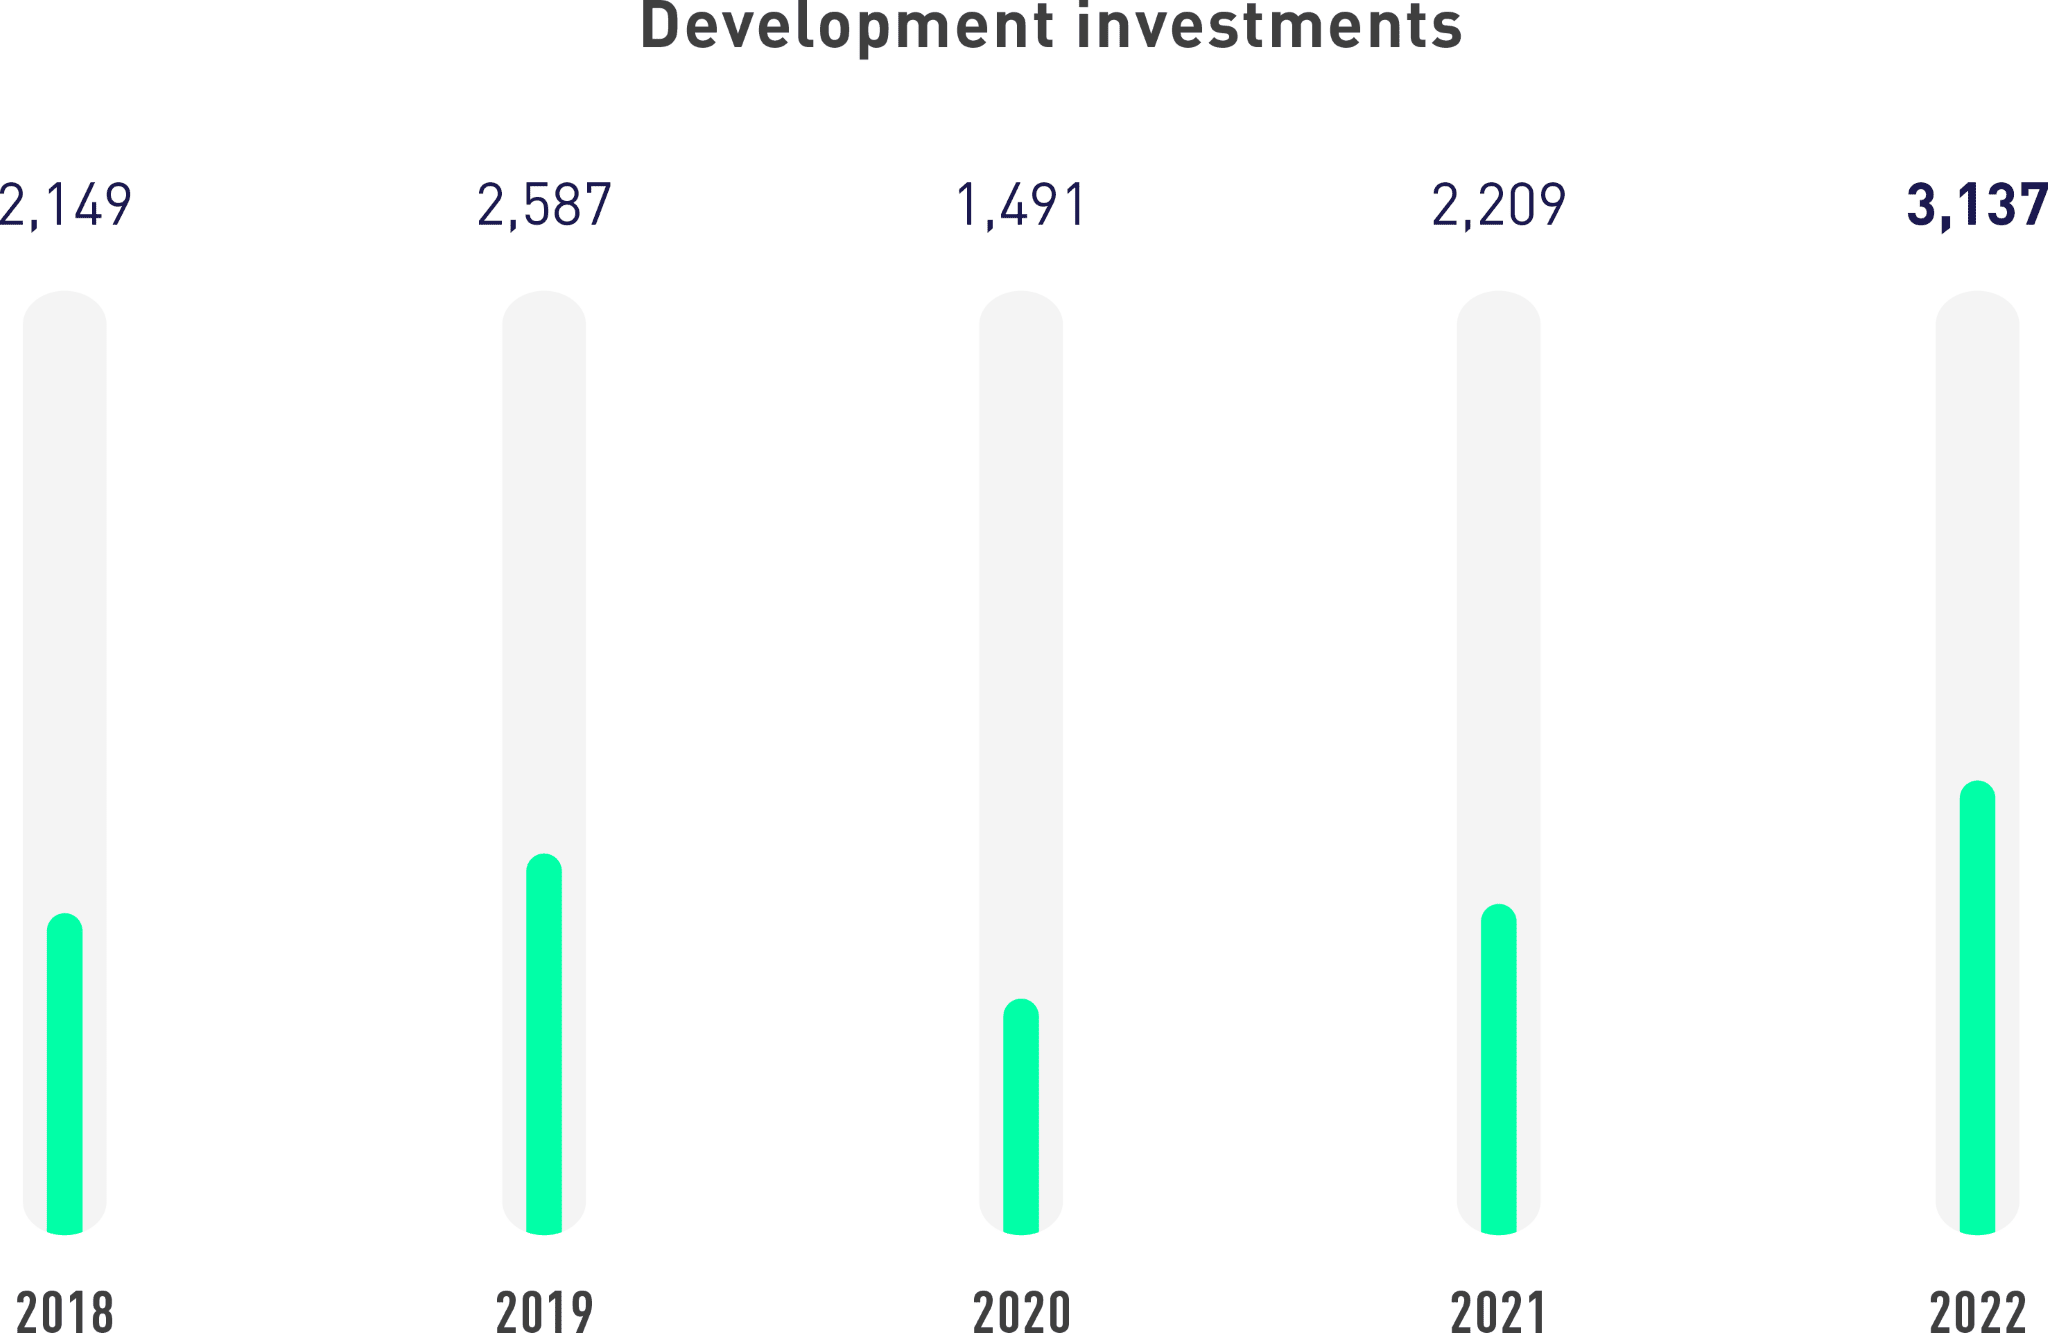
In 2022, the upstream executed a total capex of 3,576 MUSD. Exploratory investments amounted to 439 MUSD, rising 111% compared to 2021, and investments in development and production added up to 3,137 MUSD, a 42% increase compared to the previous term.
Exploration and Production Partners
The upstream partners participate in businesses and/or joint projects with Ecopetrol in the exploration and exploitation phases (development and production), with the purpose of generating value in the achievement of common objectives, within a transparent, reliable, and efficient environment of mutual benefit, framed within competitiveness and the energy transition. These relationships are regulated by formal agreements and are based on contributions from the parties.
As of June 2022, in the new segment model, the Vice Presidency of Subsidiaries and Assets with Partners (formerly the Vice Presidency of Assets with Partners) was incorporated, with the purpose of centralizing management with upstream partners, ensuring the execution of the strategy and the engagement plan, and identifying new growth opportunities by increasing partnership contracts in the portfolio.
The Company’s process flows were restructured, in line with the new model, which resulted in the creation of the new Value Maximization Flow in Subsidiaries and Assets with Partners – MFS, effective as of January 2023.
Both the Vice Presidency of Exploration and the Vice Presidency of Subsidiaries and Assets with Partners are responsible for the engagements with exploration and production partners. By year end in 2022, Ecopetrol had engaged with 25 partner companies, as shown in the table below:
| 1. CEPSA COLOMBIA S.A. | 14. PETROSANTANDER COLOMBIA INC. 1 |
| 2. COLOMBIA ENERGY DEVELOPMENT CO (CEDCO) | 15. PETROSOUTH ENERGY CORPORATION |
| 3. EMERALD ENERGY PLC | 16. SAINT – AUBIN INTERNATIONAL S.A.S. |
| 4. FRONTERA ENERGY | 17. REPSOL 1 |
| 5. GRAN TIERRA ENERGY COLOMBIA LTDA. 1 | 18. SIERRACOL ENERGY 1 |
| 6. HOCOL S.A. | 19. TEXICAN OIL & GAS LTDA. |
| 7. LAGOSUR PETROLEUM COLOMBIA INC. | 20. ISMOCOL – JOSHI – PARKO (UT IJP) TEMPORARY |
| JOINT VENTURE | |
| 8. LEWIS ENERGY | 21. SAN AGUSTIN ENERGY CORP COLOMBIA BRANCH |
| 9. NEXEN PETROLEUM COLOMBIA LTDA (CNOOC) | 22. CPVEN 2 |
| 10. NIKOIL ENERGY CORP. | 23. SHELL EP OFFSHORE VENTURE 2 |
| 11. PAREX RESOURCES 1 | 24. PETROBRAS 2 |
| 12. PERENCO 1 | 25. ANADARKO COLOMBIA 2 |
| 13. PETRÓLEOS COLOMBIANOS (PETROLCO S.A.) |
Effective members as of December 31, 2022.
- Partners with assets in the exploitation phase, with exploratory activities.
- Partners with assets in the exploration phase.
The engagement mechanisms with partner companies take place via Collaboration Contracts (Partnership, JOA, ORRI, CPI, CRC, etc.), E&P, and agreements with the National Hydrocarbons Agency (ANH).
Furthermore, strategic relationships are established with contractors that contribute to the fulfillment of objectives in abandonment and dismantling processes (subsoil equipment, communications, SES, scraping, dismantling, cleaning, environmental training, ambulances, firefighting, among others).
| Type of Contract | Total |
|---|---|
| Partnership contract (includes only risk and ORRI) | 37* |
| Exploration and production contracts with JOA | 17 |
| Incremental production contract | 4 |
| Business collaboration contract | 2 |
| Shared risk contract | 2 |
| Business collaboration agreement | 1 |
Note. As of December 31, 2022, Ecopetrol managed 63 contracts with partners.
* Includes five (5) partnership contracts transferred to Hocol S.A. as of July 1, 2018, with the area assigned to Ecopetrol.
In 2022, the investment executed in partnership contracts (exploration and production) by Ecopetrol S.A. amounted to 262.6 million dollars.
In 2022, the Vice Presidency of Subsidiaries and Assets with Partners developed a strategy together with the cross-cutting areas to manage partner relationships, including the following initiatives:
Diversity and inclusion:
Through training and the dissemination of messages related to the subject area.
Ethics and compliance:
Partners were trained in Ecopetrol’s Code of Ethics, sharing reflections and ethical discussions, as well as ratifying their commitment to ensuring ethical criteria and complying with procurement and contracting processes.
Engagement:
The first Ecopetrol Partner meeting took place in 2022, with the participation of senior leaders of both Ecopetrol and our partners, which secured the deployment of the 2040 Strategy: Energy that Transforms and addressed the main achievements and challenges in managing partners. Also, the first accounting and tax meeting was held in order to strengthen relationships and identify best practices and trends in this area, and activities were conducted to identify socio-environmental initiatives (diagnosis and baselines) in the assets held with partners.
Human rights:
Training was provided and efforts were undertaken to disseminate messages related to this subject.
Each of these initiatives was developed by implementing a plan with specific activities, and with quarterly monitoring throughout the year.

Reserve Balance
At the end of 2022, the Ecopetrol Group’s net proven reserves amounted to 2,011 MBOE, the highest in the last eight (8) years, of which 89% correspond to fields in Colombia and 11% to fields in the US.
The reserves were estimated based on the standards and methodology of the US Securities and Exchange Commission (SEC). 99.8% of the reserves were certified by three (3) renowned independent specialized firms (Ryder Scott Company, DeGolyer and MacNaughton, and Gaffney, Cline, & Associates). The price (Brent marker) used for the appraisal of the 2022 reserves was USD 97.9 per barrel compared to USD 69.2 in 2021.
The reserve replacement rate was 104% and the average life of the reserves is equivalent to 8.4 years. The Ecopetrol Group incorporated 249 MBOE of proven reserves and the total accumulated production for the year was 240 MBOE. Of the total balance of reserves, 75% are liquid and 25% correspond to gas.
A total of 215 MBOE were incorporated thanks to the management in the development fields, reflected in the optimal and timely maturation of new projects, better execution capacity, and the implementation of improved recovery expansion projects in fields such as Chichimene, Castilla, and Akacías, among others.
In terms of purchases, reserves were incorporated by acquisition and qualitative selection of areas in the Permian basin – USA (48 MBOE).
The increased reserves in 2022 are one of the pillars of the Ecopetrol Group’s strategy in order to guarantee its long-term sustainability.

| SEC Price USD/Bl | |||||||
|---|---|---|---|---|---|---|---|
| 56 | 44 | 55 | 72 | 63 | 43 | 69 | 98 |
The Ecopetrol Group’s main efforts for the incorporation of reserves in the medium and long term are focused on:
- i) The gas potential in the Colombian Caribe Offshore, Piedemonte Llanero, and the North Caribe Onshore, which will contribute to the country’s energy sovereignty and ensure the supply of natural gas to the market.
- ii) The crude potential of Llanos Orientales and Valle Medio del Magdalena, leveraged mainly on primary recovery (infill drilling) and the enhanced recovery program.
- iii) Internationally, the Permian basin in the US and the pre-salt in Brazil, in which Ecopetrol has a stake.
The maximization of reserves and production are aligned with the 2040 Strategy, where the Growing with the Energy Transition pillar seeks to maintain competitiveness in the integrated hydrocarbon chain and increase the gas supply to ensure resilience and competitiveness.
Technical Abandonment of Wells
Ecopetrol continues with its commitment to meet current legal regulations applicable to the abandonment of wells under Resolution 40230 of 2022 of the MME and Decree 1076 of 2015 of the Ministry of Environment and Sustainable Development (MADS), pertaining to environmental recovery, as well as the provisions of the internal guidelines set forth in the Guide for Well Integrity Management – WIMS (Well Integrity Management System) and the Guide for the Disincorporation of Production Assets.
According to Resolution 40230 of 2022 of the MME, definitive abandonment is “The abandonment operation executed when there is no interest in returning to the well on the part of the operator, including the location of cement and/or mechanical plugs as a primary and secondary barrier to isolate formations that produce water, gas, or oil, thus guaranteeing a transverse seal (lining-cement-formation-lithological seal).
It also includes the filling of the sub-well, the installation of the monument and the abandonment plate, and the dismantling of equipment and production facilities (the latter, provided that there are no other wells in operation in the same location), as well as environmental cleaning and restoration of the areas where exploration, evaluation, or production operations had been executed.” A total of 276 technical well abandonments were executed in 2022.
The dismantling of facilities and environmental recovery are also complementary activities to the abandonment of the well.
The dismantling of facilities consists of uninstalling and removing the facilities and equipment that are part of the asset, such as flow lines, electrical systems, electromechanical equipment, and civil works associated with the production wells to be abandoned.
This activity is the last intervention in the operating life of an asset and is conducted in accordance with applicable regulations. In 2022, 660 well-related facilities were dismantled.
For its part, environmental recovery consists of activities that guarantee the protection of the environment in accordance with the guidelines set forth in the environmental instruments of the areas and with established legal norms. These activities include: erosion control and slope management, maintenance of recovered areas, waste management, revegetation or reforestation of the land, and runoff water management and control. A total of 161 environmental recoveries were completed in 2022.
Transport
This is the third link in the hydrocarbon business line value chain, and includes the transportation of crude oil, fuels, and other refined products such as diesel and biofuels. These activities are conducted by Cenit and its subsidiary companies.
Transportation Operations
Management and Maintenance
In 2022, an average of 772,641 KBPD was transported by oil pipelines and 298,119 KBPD by polyducts, registering a total transported volume of 1,070.76 KBD.
Crude oil
The volume of crude oil transported7 using Cenit’s systems and those of its subsidiaries grew by 5% compared to the previous year, as a result of the higher production of the fields (mainly Caño Limón, Piedemonte, Rubiales / Caño Sur) and the incremental capture of barrels (mainly from of the Nare, CPO5, and CPI Suroriente fields). Of the total volume of crude oil transported by pipelines, roughly 84.2% was owned by the Ecopetrol Group.
Refined products
Main midstream achievements, results, and logistics solutions:
The 2022-2040 corporate strategy for the transport segment was approved with some commitments and strategic aspirations defined for 2030, targeting an optimization model for the current business and diversification towards alternative businesses geared towards the path of sustainability and energy transition.
Consolidated segment revenues amounted to more than 14 TRILLION COP (CAGR +15% vs. 2021), and EBITDA generation came close to 11 TRILLION COP.
Fulfillment of 236% of the decarbonization plan with respect to the goal set for the transportation segment, with emission reductions of 21,326 tCO2eq in 2022.
The renewable energy strategy was developed, tracing the route for the energy transition. Commissioning of the solar plants of Gualanday (0.42 MW), Retiro (0.06 MW), Cartagena (50 KW – Reficar green hydrogen pilot), and the MicroLNG plant
in Buenaventura.
The acquisition and commissioning of a small hydroelectric plant, Cantayús (4.3 MW), the first for the Ecopetrol Group, in the municipality of Cisneros in the department of Antioquia. This asset constitutes a significant advance in Cenit and the Ecopetrol Group’s energy transition plan, since it will avoid about 63 thousand tons of CO2 emissions in 15 years, thus contributing to the reduction of Cenit’s carbon footprint. This is the first hydroelectric self-generation scheme in liquid hydrocarbon transportation systems using the country’s pipelines.
The Analytics Intelligence Center was consolidated, with the creation of five (5) high performance cells (team of experts gathered temporarily to solve a need for the company). More than 25 analytical solutions that impact the core business and its support processes were built.
The polyducts were operated with minimum Transmix generation, in compliance with regulations and contributing to the improvement of the air quality for Colombian citizens.
The centralized operation was executed efficiently, complying 100% with the commitments in the transportation of crude oil and refined products, while capturing additional volumes.
The high performance of the polyduct network, the use of alternative logistics solutions, and the alignment of the Group’s operating planning teams enabled higher volumes to wholesale centers, ensuring better coverage of national demand, which contributed to the optimization of expenditure from the Fuel Price Stabilization Fund (FEPC). Highlights include the PPG systems and the evacuation of the Barrancabermeja and Cartagena refineries.
Products with a lower API (from 29° to 24° minimum) were transported in the OTA, allowing the capture of barrels. 1 Mbls were imported in Coveñas, with an outstanding performance of the Coveñas – Cartagena system, which transported 84% of the cargo from the Cartagena refinery along the pipeline.
Obtaining the CARBON NEUTRAL certification granted by ICONTEC for the transport segment.
Maritime or Port Operation
Cenit’s port operations in 2022:
| Export capacity available in ports | 3,216 kbpd |
| Number of ports | 3 |
| Vessels served by Cenit | 230 |
| Export Volumes | 2020 | 2021 | 2022 | Destinations |
|---|---|---|---|---|
| Coveñas | 522.4 kbpd | 435.5 kbpd | 462.765 kbpd | The export destinations of the crude oil evacuated by the terminals include the United States (largely towards the Gulf of Mexico), Panama, Asia (China and Singapore), and Europe (ports in Spain). |
| Tumaco | 6.1 kbpd | 9.44 kbpd | 6.4 kbpd |
| Import Volumes | 2021 | 2022 |
|---|---|---|
| Pozos Colorados | 116.606 kbpd | 139 kbpd |
Total Number and
Volume of Spills in 2022
Due to operating causes, six (6) spills with soil damage were recorded in 2022, and one (1) affecting a body of water. Compared to previous years, there has been a successive decrease in events, from 13 (2020) to 10 (2021) and 6 (2022), which shows the positive impact of the improvement actions implemented on the operation. On the other hand, 296 containment losses were recorded in 2022, most of them caused by third-party events and two (2) associated with natural causes.
To address this type of situations, mitigation and contingency plans have been implemented for the recovery of natural resources in the event of spills9.
| Cause | Actions |
|---|---|
| Operating origin |
|
| Situations caused by third parties, force majeure, or fortuitous events |
|
Commitment to Human Rights:
219 service contracts were signed at Cenit, all of which contained a Human Rights clause.
TESG Indicators
Starting 2020, Cenit took on the corporate commitment to lead its business model on the path of sustainability and energy transition through the TESG strategy.
For Cenit, TESG is an enabling perspective of the corporate strategy, a competitive advantage, and the most valuable tool to create value for Stakeholders, based on four (4) objectives: environmental, social, governance, and technology and innovation (TESG, as per its English acronym), as illustrated below:
We are an ethical and transparent business with the best good governance and accountability practices. We establish trusting relationships with our stakeholder groups by promoting the respect for Human Rights.
Our business and operation are based on sustainability criteria. We are committed to life, profitability, efficiency, innovation, and energy and digital transformation.

We contribute to the growth of the territories by engaging with the communities, our employees, suppliers, and contractors, acknowledging their diversity and fostering equity and inclusion.
Our decisions follow an environmental focus centered in the climate conversation, the circular economy, biodiversity, and the regeneration of ecosystems. We will establish ourselves as a carbon neutral company.
| Purpose | Indicator | ResultResultsado |
|---|---|---|
| Objective 1: We contribute to global well-being | TRIF | The indicator closed at 0.18 in 2022 for Cenit, against a limit of 0.45. |
| Installed capacity in MW of renewable energy and total consumption of renewable energy | By 2022, Cenit had 60.6 MW of solar energy installed capacity, with a photovoltaic solar system for the generation of energy from the San Fernando plant and smaller plants. | |
| Objective 2: We are an innovative and environmentally responsible business | Reduction of accumulated GHG emissions between 2020 – 2025 | In 2022, GHG emissions reduced by 6,631 tons of CO2e as a direct consequence of the Nodo Llanos optimization projects, electrification in Copey, the San Fernando solar park, smaller plants, and the energy efficiency program. |
| Carbon Neutrality | The milestone of certifying the entire midstream segment was met (Cenit and its subsidiaries), and it was the first in the Oil & Gas value chain to obtain this global certification. | |
| TESG Stations | Initiation of the TESG Stations program to materialize circular economy practices at Cenit’s stations. | |
| C – Siembra | This program contributes to the goal set by the country of planting 180 million trees between 2018-2022. In 2022, Cenit contributed a total of 463,630 trees to the goal. | |
| Objective 3: We add value to the territories where we operate and to the well-being of our human talent | Execution of the socio-environmental investment program | The socio-environmental investments executed in 2022 amounted to 63.3 BCOP, of which 51.7 BCOP correspond to voluntary and 11.6 BCOP to mandatory investments. |
| Objective 4: We act with the highest Corporate Governance, Transparency, and Human Rights standard | % of compliance with the activities schedule for the 2022 Corporate Governance model. | The Corporate Governance model’s activities schedule was 100% completed, particularly the following activities: implementation of best corporate governance practices; inventory of the organization’s alignment and engagement committees and meetings, authority delegation manual; engagement model between midstream segment companies. |
| % of operations submitted to a human rights impact analysis | In 2022, Cenit conducted an exercise to assess human rights impacts in the southwestern part of the country, in the departments of Nariño, Putumayo, and Valle del Cauca. This geographical area represents 13% of the subsidiary’s operation. | |
| # people/hours dedicated to human rights training | Virtual course on general Human Rights and Company information, main international due diligence standards, and internal tools to implement the corresponding good practices. The course had a duration of roughly 445 hours and a total of 891 participants (82% of Cenit’s employees) completed it. | |
| Transparency Perception Index | In the measurement taken annually by the Office of the Inspector General of the Nation (ITA Indicator), the Company scored 95% in its Information Transparency Index. |

Refining and
Industrial Processes
The fourth link in the hydrocarbon business line value chain is the refining and petrochemical activity, which includes the Barrancabermeja and Cartagena refineries and Esenttia. This activity transforms the crude oil coming from the fields (domestic and imported) into value-added products.
In 2021, the downstream segment’s (refining and petrochemical) strategy was updated for the period of 2022-2040. Accordingly, new strategic options were generated to complement, refocus, and prioritize some aspects of the previous strategy update in 2017 (with a perspective towards 2020-2030), as well as add new options to increase the competitiveness and diversification of the business given the new challenges in the industry, using levers such as TESG, growth in the energy transition, decarbonization, competitive returns, and cutting-edge expertise.
The identified options were prioritized and classified into:
- i) Necessary initiatives
related to the achievement of clean fuels, sustainability, and maximizing asset value. - ii) Large commitments
that would give options to the business and that require additional analysis to propose an outlook. - iii) Real options
offering low capex stocks to explore potential new sources of high growth and rely on technological advancement, the market, and regulation to scale them. - iv) Discarded
in which the options that are not aligned with the direction of the Company’s strategic objectives or the trends of the segment at an international level are dropped.
As part of the large commitments, the best option to increase the value of the surplus virgin naphtha from the Cartagena refinery must be determined. One of them is a reformer towards aromatics, which presents an attractive economic case in all scenarios, with a moderate capex that can be deployed in different stages over time, generates a large production of hydrogen and a significant impact on the decarbonization of the refineries. Another option is an olefin complex, which allows greater integration in the downstream segment, improves Colombia’s trade balance, and whose market demand is growing healthily.
As an option to diversify into low emission businesses, the configuration of assets can be transformed to meet the demand for emerging products in the medium and long term, such as green/blue hydrogen, and part of the refineries can be reconverted to produce biofuels, increase the trading of base oils, petrochemicals, and industrial products, increase the production capacity of Ecodiesel, diversify the business, and become pioneers in mechanical and chemical recycling (through circular economy initiatives).
The segment’s strategy seeks to build resilience in current operations and capture new value in petrochemicals and new businesses. It generates a portfolio of strategic options targeting an EBITDA of more than 1 BUSD and
a competitive ROACE by 2040.
In the traditional business, the purpose is to maintain the function of supplier to meet the fuel demand in Colombia, optimizing the current capacity while generating profitability for the Ecopetrol Group, through comprehensive planning, adding value to domestic crude oils, and capturing efficiencies (with the ambition of reaching US Gulf Coast levels), in compliance with the quality and decarbonization paths embarked on. All of this, accompanied by the Zero Fuel Oil initiative as part of the combined margin improvement.
In terms of diversification, the objective is to sustain the size of the business by creating attractive, cost-efficient, and flexible investment options to integrate fuels into petrochemicals and biofuels, depending on the evolution of demand and of the market.
From the TESG perspective, the goal is to capture opportunities in new low-emission businesses, in line with the energy transition, transforming the configuration of assets to meet the demand for emerging products in the medium and long term (e.g., green/blue hydrogen), and become leaders on circular economy related matters, by being “first movers” in recycling issues involving the territories in which Ecopetrol operates. The sustainability of the operations will improve through integrated water management, aligned with the Group’s water neutrality strategy and social and environmental responsibility at the center of these efforts.
With regard to cutting-edge expertise, the development of human talent remains a priority to face the new challenges of the energy transition through adaptive leadership.
In 2022, important progress was made in the development of the segment’s strategy, including the following:
Strengthening of the traditional business
Development of conceptual engineering for the baseline fuel quality projects at the Barrancabermeja refinery and the U107 naphtha polishing reactor at the Cartagena refinery to adapt the facilities to the 10 ppm sulfur content legislation applicable to regular gasoline by 2030.
Signing of contracts for additional production of refinery grade propylene (PGR, as per its Spanish acronym) from the refineries to the Esenttia subsidiary to increase the stake in Petrochemicals.
Zero fuel oil: formulation of alternatives to increase asphalt production at the Barrancabermeja refinery and start production at the Cartagena refinery.
Zero fuel oil: development of phase I for the expansion of the coke unit at the Cartagena refinery.
Commissioning of the U-001 original crude oil unit at the Cartagena refinery, as part of the completion of the crude plant integration project, which raised the nominal load of this refinery to 230 KBD.
Approval of the startup of the initiative to change technology to HF alkylation at the Cartagena refinery.
Diversification
In biofuels:
- i) The feasibility study was conducted for the possible production of diesel (HVO) and renewable jet fuel at the paraffin plant in the Barrancabermeja refinery.
- ii) The study to define the growth path of theEcodiesel subsidiary was completed.
- iii) A 5% palm oil co-processing test was conducted at the loading point of the U-109 diesel hydrotreater in the Cartagena refinery.
In petrochemicals: the study on the best alternative for petrochemicals in Cartagena between the olefin and aromatic complexes was completed.
In low emissions:
- i) The pilot test was conducted for the production of green H2 at the Cartagena refinery.
- ii) Phase I of the green H2 production projects was approved at the refineries, with an estimated capacity of 10 MPCED each.

TESG
In decarbonization:
- i) The startup of the blue H2 production initiative by bottoms gasification at the Barrancabermeja refinery was approved.
- ii) Well studies for CO2 storage began in the Magdalena Medio area.
- iii) The 2023-2050 decarbonization study was completed for the downstream segment in scopes 1, 2, and 3, which seeks to build a detailed route to achieve the goal of carbon neutrality in operations by 2030 and 2050.
In terms of electricity self-generation with renewable energy, solar park projects are being developed at both refineries to reduce energy demand.
- In circular economy:
- i) Phase I of the Esenttia chemical recycling project for the future production of 3 kilotons per year (or kilo tons per annum, KTA) was presented.
- ii) Progress was made in the construction of the 12 KTA mechanical recycling plant at Esenttia.
- iii) Tests were conducted on the reuse of clarification sludge from the Barrancabermeja refinery.
- iv) Pyrolysis tests were conducted in the cracking and coker pilot plant.
- v) The construction and demolition waste (RCD) pilot test was conducted at the Cartagena refinery.
- vi) The use of hazardous waste such as oily and non-hazardous sludge increased.
- vii) Organic waste composting initiatives and PlastiTon were leveraged.
- In water neutrality:
- i) The study to define the road map towards water neutrality by 2023-2050 for the downstream segment was completed.
- ii) The construction of the digital integrated water management tool started for the Barrancabermeja refinery.
- iii) A third party conducted a water footprint verification for both refineries, in accordance with the NTC-ISO 14046 standard.
- In solid waste: catalyst regeneration tests began to reuse them in the process.
- In digitization:
- i) The startup of advanced analytics initiatives was approved for both refineries.
- ii) The Visual Mesa tool came into service at the Barrancabermeja refinery for the online optimization of electricity generation to improve efficiency in natural gas consumption.
Cutting-edge expertise
The following measures were adopted to prepare human talent in the downstream for the challenges associated with the 2040 Strategy:
- i) The implementation of process simulators for the training of panel builders.
- ii) The first equipment retooling phase of the segment in energy transition and digitization.
- iii) The graduation of the first class of operators and supervisors, refining and petrochemical process engineers in Barrancabermeja.
Inversiones del segmento downstream
Barrancabermeja Refinery
The investments made by the Barrancabermeja refinery in 2022 amounted to 210 MUSD, related to reliability (142 MUSD), regulatory legal compliance (44 MUSD), HSE (11 MUSD), and TESG (13 MUSD) initiatives and projects.
In line with the segment’s strategy, the following projects stand out as part of the execution for the year:
Reliability in the amount of 142 MUSD:
The plant experienced 22 shutdowns in 2022, mainly due to maintenance of primary systems, including the following: maintenance of the UOP I Train, tanks, industrial services, SG5100, orthoflow, HCM, Tea 6, Rotors, major equipment, environmental train, skimming prime D, U650 specialties, U150 topping, HDT prime G, sour water projects, flue gas cooler and UOP I bottoms circuit, B2880 sulfur II system, UOP II availability, UOP I retrofit technological update, marpol stage I and 1:1 replacements of internal R2702, UOP I riser, U2100 static equipment, U650, rotary equipment stage I, crude boards, 35kV ring cables, UOP I pressure vessels, drum D1216.
Regulatory legal compliance in the amount of 44 MUSD:
New WWTP wastewater treatment plant, SOX emissions control sulfur plants, fuel quality baseline to ensure regulatory compliance in terms of quality, 10 ppm sulfur diesel and regular motor gasoline, and technological improvement at the HCM plant.
Health, safety, and environment (HSE) in the amount of 11 MUSD:
containment of the riverbank, replacement of mobile emergency response equipment, safeguarding furnaces, and a new laboratory at the Barrancabermeja refinery.
TESG in the amount of 13 MUSD:
Technological changes to the lighting systems at the Barrancabermeja refinery, blue hydrogen production
studies with gasification and decarbonization using CCUS.
Cartagena Refinery
The Cartagena Refinery invested nearly 189 MUSD in 2022, associated with reliability (115 MUSD), HSE (26 MUSD), and regulatory legal compliance (5 MUSD) initiatives, and growth and profitability projects (43 MUSD).
The following projects stand out in 2022, which were structured with the purpose of guaranteeing:
Reliability in the amount of 115 MUSD:
The plant experienced nine (9) shutdowns due to maintenance of primary systems, such as: major maintenance (MM) of the U-111 coker, MM of U-100 Crude oil, MM of Turbines, MM of the U-108 and U109 diesel hydrotreaters, MM of the U-115 hydrogen, MM of compressors, MM of boilers, and MM of tanks.
Health, safety, and environment (HSE) in the amount of 26 MUSD:
Fire-fighting system for the Cartagena terminals, LPG comprehensive management, water supply system for boilers, and cargo lifting facilities.
Regulatory legal compliance in the amount of 5 MUSD:
Conversion plan to clean technologies and discharge management at the Cartagena refinery, improvements to the U-107 unit (incorporation of CDTECH Technology), and automatic air conditioning filtration system.
Growth and profitability in the amount of 43 MUSD:
Interconnection of crude oil plants, increase in capacity of the U-111 coking unit to 50KBD, energy consumption optimization, and U-111 drum heating facilities.
The graph below shows the consolidated investments for the refineries in the last five (5) years.
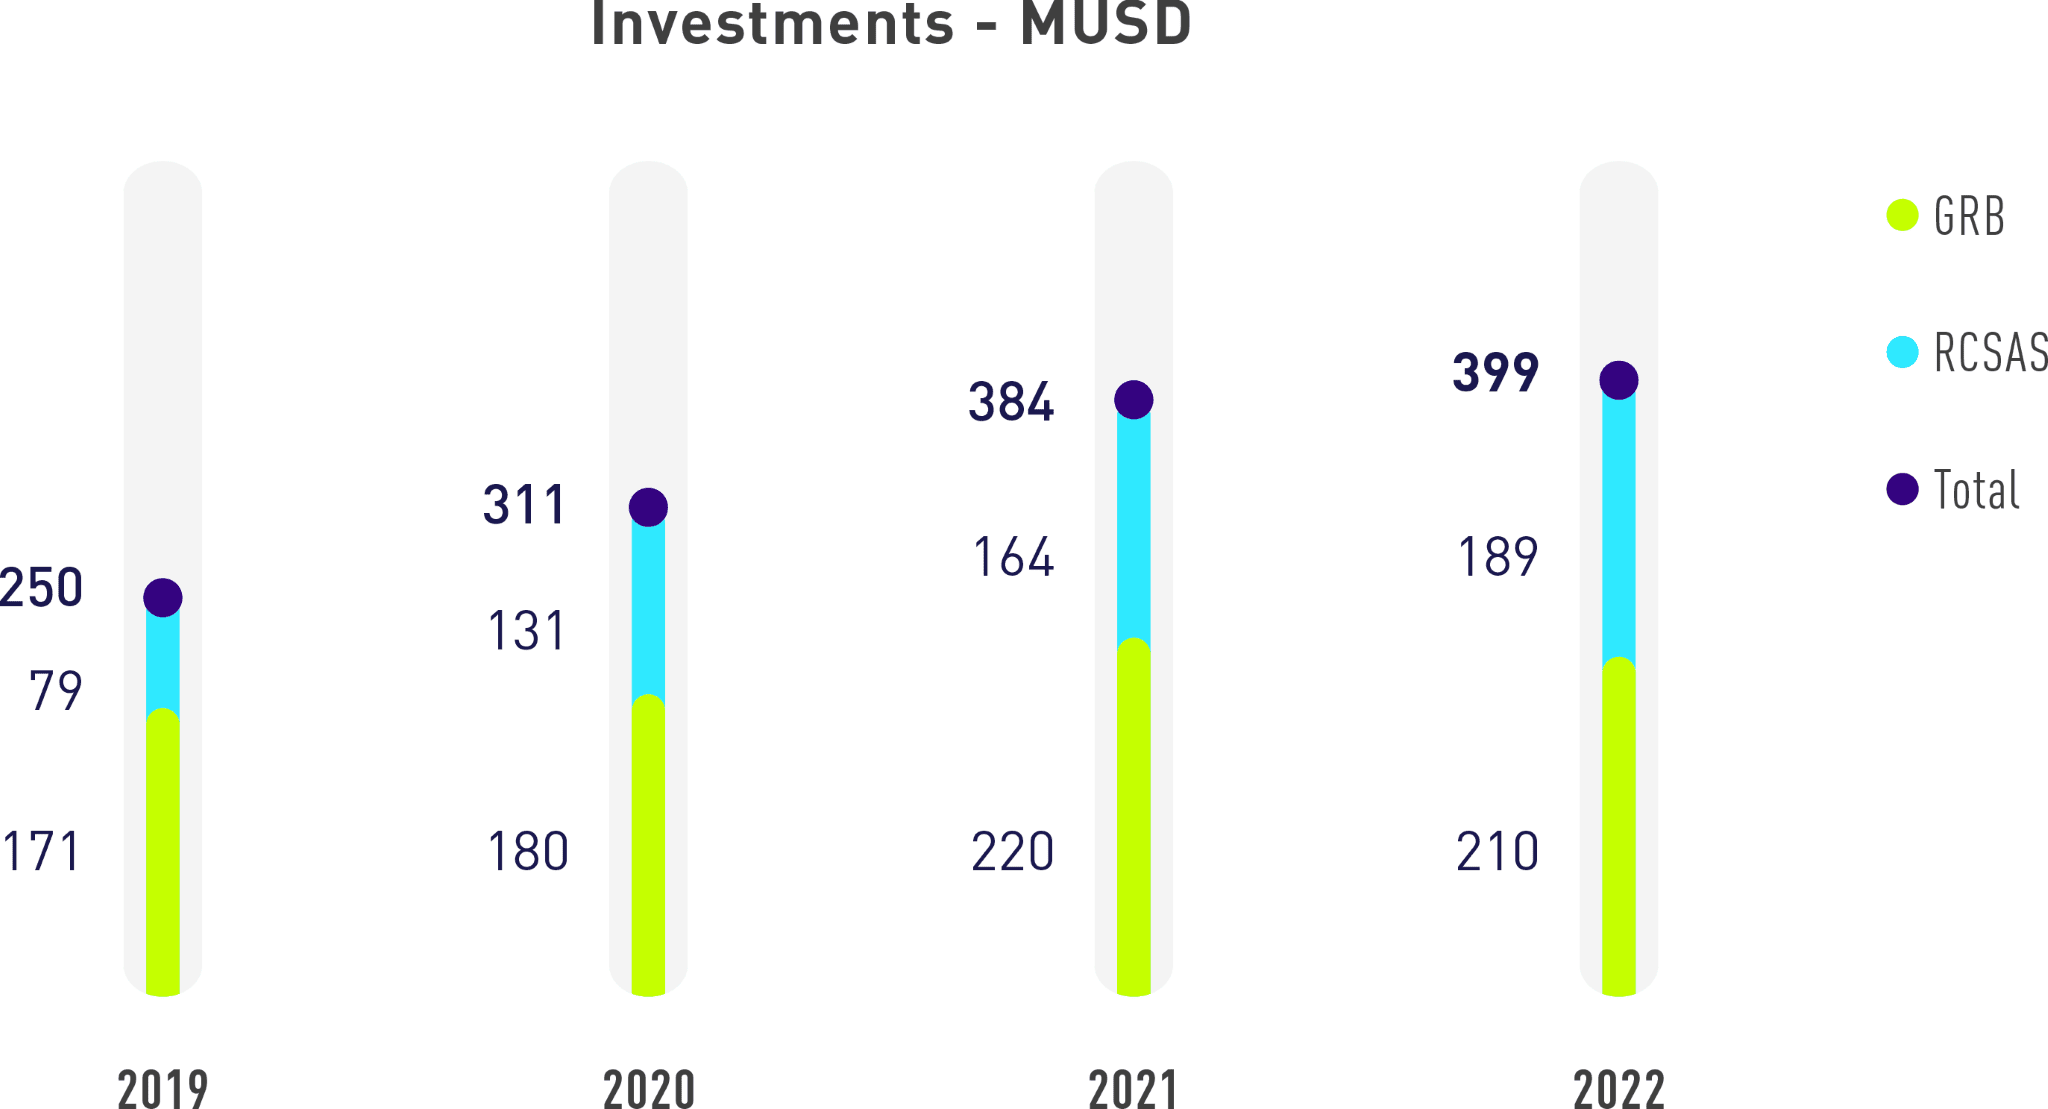
In 2022, the refining segment generated a load of 357.5 kbd, the highest in the last 3 years, and an annual historical gross margin record of 21 USD/Bl. In 4Q22, consolidated cargo accounted for 344.9 kbd and the integrated gross margin closed at 19.9 USD/Bl.
The segment’s results were leveraged by operating and commercial tactical strategies that led to:
- i) Adjustments in the shutdown execution strategy to capture the benefits of the market environment, and ensure operating stability at the refinery units and petrochemical plants.
- ii) Integrated planning of the logistics chain to maximize the consumption of national crude oil in the refineries.
The following benefits were also captured:
- i) High differentials in the product basket versus Brent.
- ii) An efficient commercial strategy to capture business opportunities.
- iii) Higher levels of PGR (Refinery Grade Propylene) delivered by the refineries to Esenttia.
Since July 2022, the Ecopetrol Group has been supplying gasoline with less than 50 ppm sulfur content, and since January 1, 2023, also diesel with 15 ppm sulfur content (under Resolution 40103 on Fuel Quality), thanks to the operational and logistics adjustments made in 2021 and 2022.
Trading
Trading is the last link in the hydrocarbon business line value chain, generating value through excellence in the purchase and sale of quality products, and committed to TESG and a solid engagement with customers and suppliers.
The products marketed include the following:
Crude oil
ACPM or diesel
Fuel oil
Jet fuel
Regular and premium motor gasoline
Queroseno
Aviation gasoline or avigas
Petrochemical, chemical, and industrial products
In the 2022 period, no Stakeholder Groups associated with the Commercial and Marketing Vice Presidency, that is, customers and suppliers, raised any questions regarding the products marketed.
The trading subsidiary in Singapore, Ecopetrol Trading Asia, was inaugurated in September 2022, which will increase the commercial value of Ecopetrol products. This adds to the Company’s improved geographical position at the international level.
Ecopetrol Trading Asia will focus on the diversification of clients in China and India, access to new markets in Asia, third-party trading, and the exploration of opportunities for new sustainability businesses and carbon credit markets. With this same objective in mind, the subsidiary Ecopetrol US Trading was incorporated in the US in November 2022, which will begin operations in the third quarter of 2023.
Clientes en la línea de negocio de hidrocarburos
Crude oil
Ecopetrol’s portfolio of international crude oil clients consists of 23 active companies, 74% refiners that use crude oil as raw material to load their refineries and produce refined products for different uses, and the remaining 26% marketers, whose engage in commercial intermediation to access new clients and markets.
Liquid fuels
Ecopetrol currently serves 43 clients, 31 national and 12 international. The latter purchase gasoline, diesel, jet fuel, marine diesel, fuel oil, kerosene, and avigas. National customers must be authorized by the MME and/or the Energy and Gas Regulation Commission (CREG) to make purchases.
Petrochemical and industrial products
Ecopetrol currently serves 149 clients between transformers and traders. The products purchased by the clients include solvents, lubricant bases, paraffins, polyethylene, asphalt, sulfur, propylene, aromatic tar, and coke, which serve as raw materials to manufacture a large number of products for end consumers, such as glue, paint, plastics, candles, and car lubricants.
Fuel transport
Shippers must meet the requirements set forth in Decree 1609 of 2002 or in the regulations that modify, replace, or add to it. The activity of transporting petroleum-based liquid fuels by polyduct is governed by the transport regulations issued by the MME for this purpose. Vessels transporting petroleum-based liquid fuels travelling by sea or river must carry a single waybill.
Sale of controlled products
In accordance with current regulations, as a national public entity, Ecopetrol is not required to hold a Certificate of Clearance from Technical Narcotics Reports (CCITE). Neither is it obliged to exert any control over the agents in the fuel distribution chain registered in the fuel distribution chain information system (SICOM), nor is it responsible for verifying the CCITE of its clients.
However, measures against said products have been adopted at Ecopetrol, such as requesting a certificate of clearance from clients prior to signing a contract or sales order, and periodic verification of the reported quota against the quantities dispatched. A detailed procedure for the trading of controlled chemical substances and products has also been implemented.
Product labeling and delivery regulation
In line with the National Action Plan for the Management of Chemical Substances in Colombia established by the Ministry of Environment and Sustainable Development (MADS), in 2022, Ecopetrol’s HSE division has continued with the implementation plan of the globally harmonized system, with processes for updating chemical product safety data sheets and training for workers.
In 2022, the Company participated in the socialization of the web application known as National Inventory of Chemical Substances for Industrial Use – INSQUI. The lines of work under the 2022-2024 chemical risk management operating plans were reviewed and structured in the last quarter of 2021 and, by the end of 2022, the planning and scheduling of said plans were being finalized.
Operational Results
Ecopetrol S.A.’s general income for 2022 amounted to 29.989 BUSD, growing more than 47% compared to the previous year.
Exports represented 13.329 BUSD in 2022, growing 42% in comparison with the previous year.
Domestic sales in BPD (barrels per day) for 2022 were as follows:
- Gasoline: 124,396
- Diesel: 110,909
- Jet fuel: 23,603
In 2022, crude oil sales accounted for a 62% share of total sales, products 36%, and petrochemicals 2%.
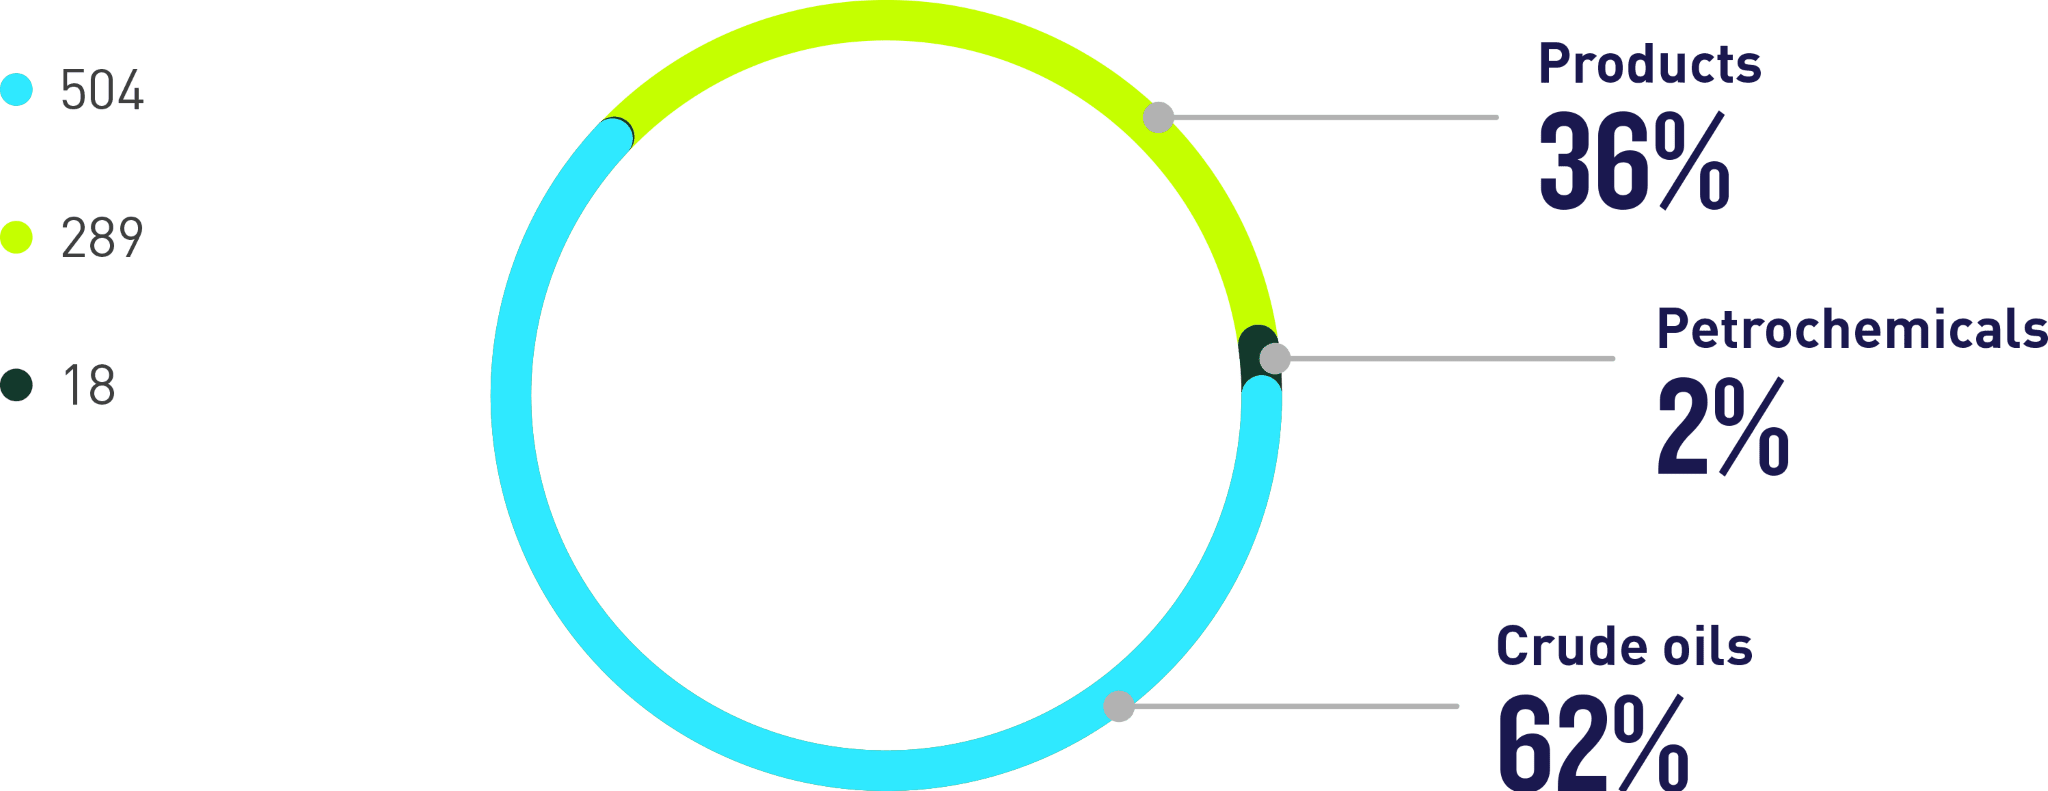

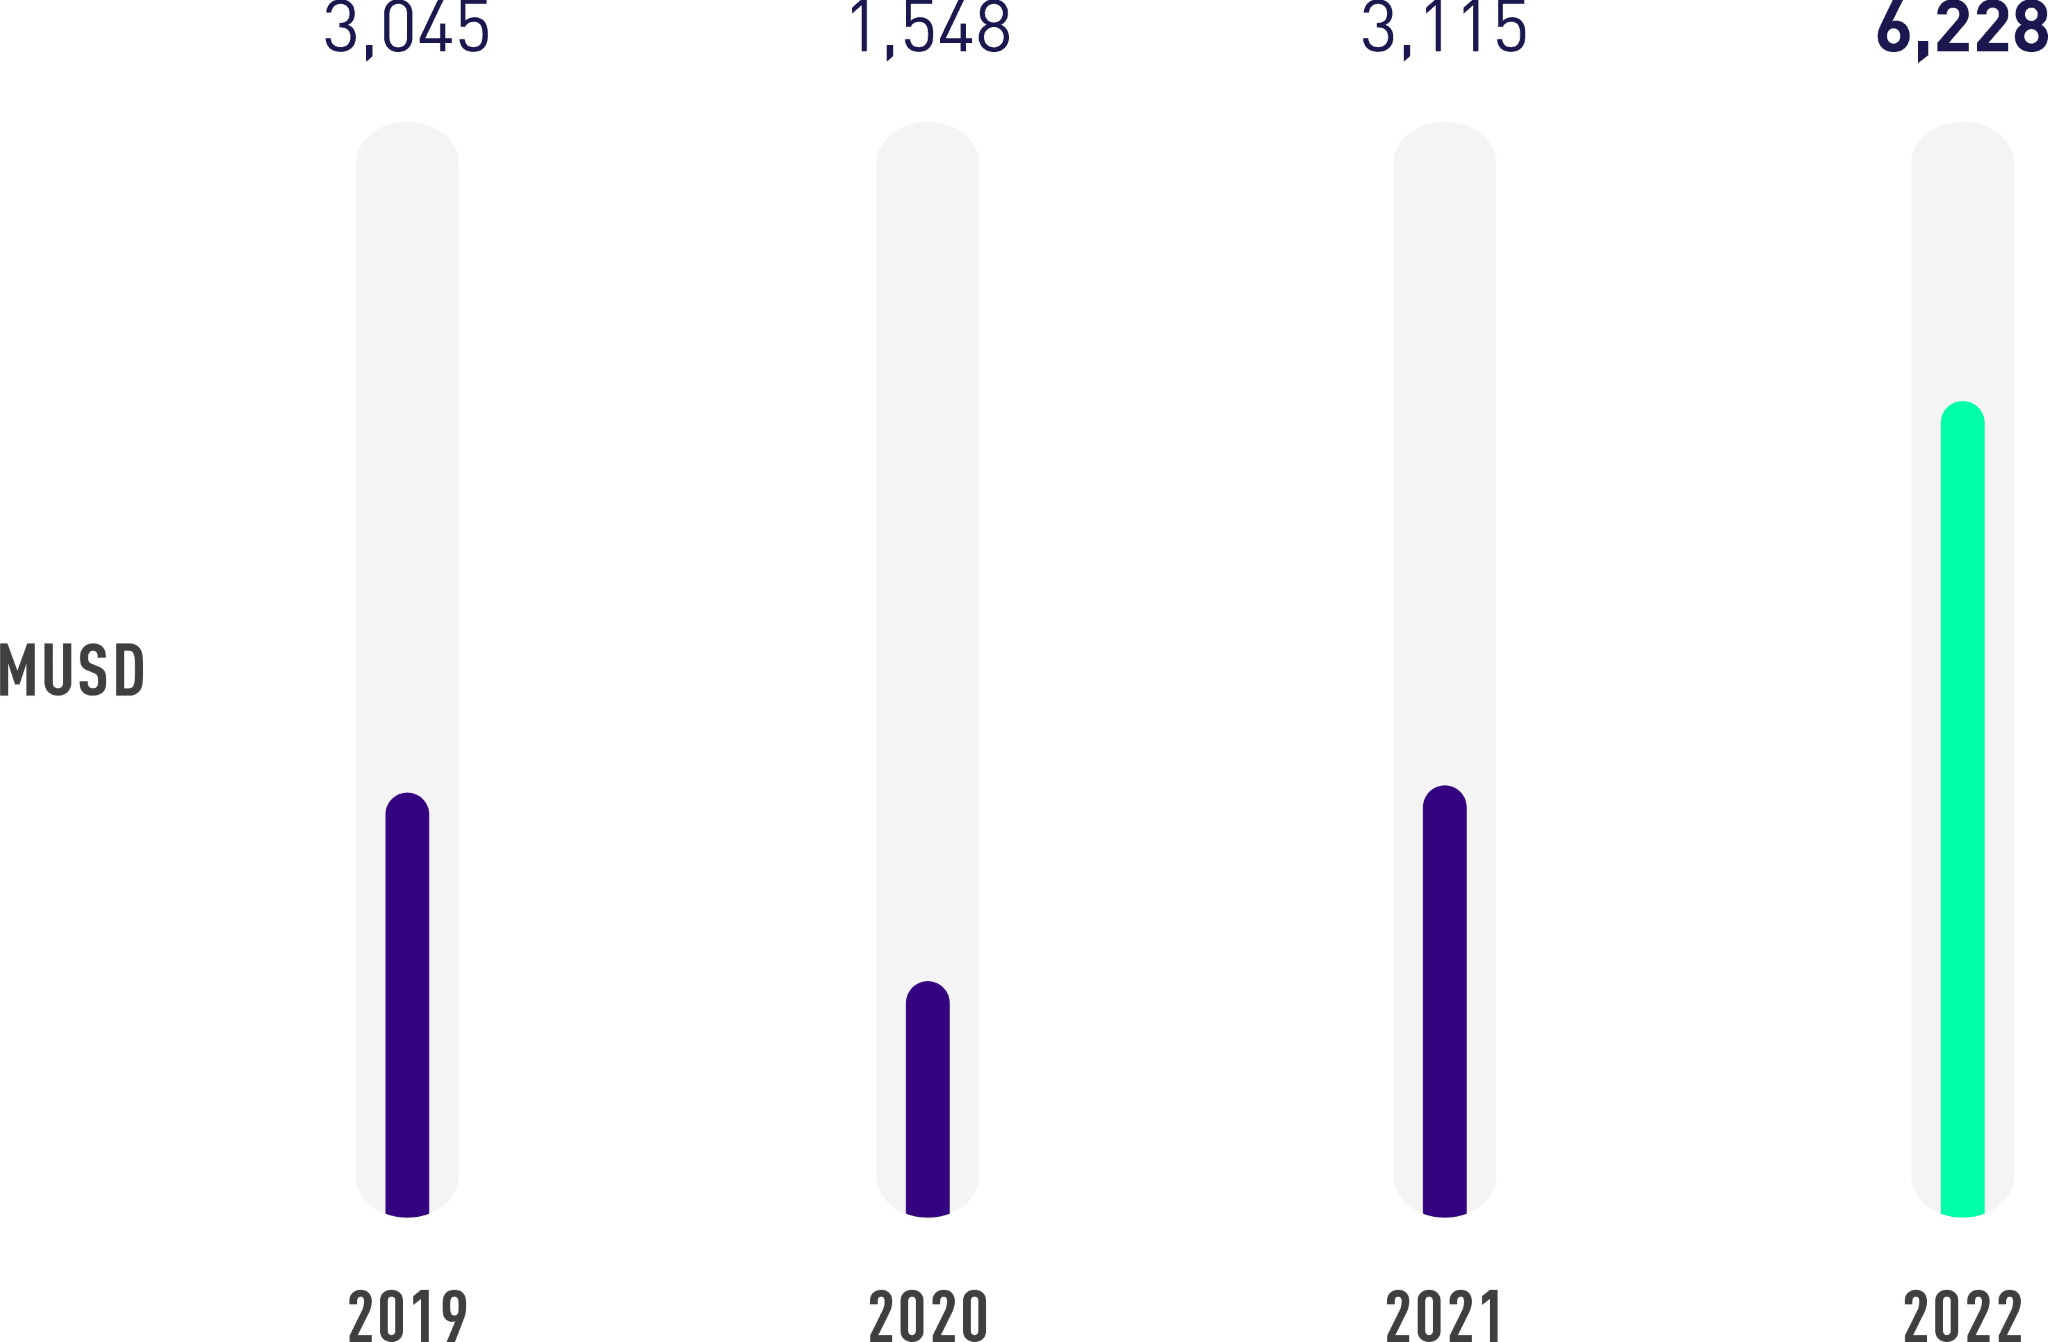


III.4.2. Low Emission
Solutions Business Line
This entails the development of the LPG, biogas, energy management, hydrogen, renewable energy, carbon capture, storage and use, and geothermal businesses, among others. The objective is to conceptualize and build a comprehensive energy solutions portfolio for the diversification and decarbonization of the Ecopetrol Group’s operations, leveraging cross-cutting synergies with other business lines.
Strategy
In 2022, the Vice Presidency of Gas became the Vice Presidency of Low Emission Solutions with the purpose of adding a portfolio of comprehensive energy solutions to the Ecopetrol Group’s DNA, based on natural gas, LPG, biogas, renewable energies, hydrogen, and CCUS. This portfolio is essential to achieve the goal of carbon neutrality in Scopes 1 and 2 by 2050. Similarly, the reduction of fugitive emissions, energy efficiency programs, and the incursion into natural climate solutions and energy storage infrastructure will be critical to achieve this objective.
This integrated portfolio will contribute to equitable access to energy products as follows:
- i) Achieving the goal of connecting more than 300,000 new households in vulnerable areas in the country by 2035, by establishing partnerships with entities, territorial entities, and distributors in the social gas program, which will benefit more than 10.5 million families currently using natural gas and 3.5 million using LPG.
- ii) By supplying products such as gas, biogas, and hydrogen to promote sustainable mobility and support Comprehensive Mass Transportation Systems (SITM) in large and medium-sized cities.
- iii) The promotion of energy efficiency.
- iv) The creation of energy centers in the country (Caribe, South, Central, Orinoquía).
The strategic plan evolves with natural gas as a central component. This energy source is essential for the country’s self-sufficiency and to enable the energy transition with an expected 30% stake in production for the Ecopetrol Group by 2030, as well as a gas portfolio that has been allocated capital and activity in the last two (2) years, allowing exploratory successes and the optimization of basic curves, thus reducing the uncertainty thereof. The above was complemented with key actions in Piedemonte’s development strategy (e.g., with the integrated Piedemonte train model and a lateral well drilling strategy) to continue drilling in mature fields, identifying competitive opportunities for easy connection to existing facilities, the identification of projects for the connection of offshore wells with the National Transportation System, the expansion of the transportation infrastructure, the generation of optional sources (e.g., micro LNG, biogas, and regasification projects), trading operations and development of regional gas markets, among others.


Moreover, it contemplates the permanent optimization of the Ecopetrol Group’s energy systems, both electrical and thermal, increasing the reliability of energy supply for its own operations, incorporating operating improvements and new technologies to advance in the energy efficiency program, which is expected to reduce at least 10% in consumption by 2040, and materializing synergies with Group companies, especially ISA, which holds relevant expertise and experience on the matter.
Solutions will be implemented along the same lines to decarbonize current operations, with technologies to capture, store, and maximize the CO2 currently emitted into the atmosphere, and incorporating renewable energy sources, with an estimated capacity of 900 MW in operation and construction by 2025. The evaluation of energy market diversification opportunities will continue into 2030.
Low-emission hydrogen will become more relevant as of the development of a profitable and competitive line to decarbonize and diversify the business with investments that will allow production of up to one (1) million tons per year by 2040, of which 40% would be associated with green H2, 30% to blue H2 with the incorporation of CCUS technologies, and 30% to white H2, with applications in own operations, sustainable mobility as a complement to gas, mixing with gas in pipeline transportation systems, and the generation of new products.
To achieve the above, the Investment Plan approved for 2023 includes a commitment to the energy transition, with investments between 5.9 and 6.8 TRILLION COP in renewable self-generation, hydrogen, transmission and toll roads, and energy efficiency. In addition to its commitment to gas self-sufficiency, with investments between 3.6 and 4.1 TRILLION COP, mainly for exploration and production projects in the plains in Piedemonte, the continental Caribe region, and offshore.

The proposition of this integrated vision is as follows:
- i) To develop the business of selling individual and isolated products to offering integrated low-emission energy solutions adaptable to market needs.
- ii) To contribute to the democratization of energy with a social perspective for all our products and to the reliability of supply to the different sectors and populations, by implementing a decisive plan for social gas and energy in vulnerable populations, isolated areas, and bordering areas, facilitating the development of new regions beyond those directly associated with our current operations.
- iii) To grow regionally with this portfolio, maximizing synergies with infrastructure subsidiaries such as ISA and CENIT, positioning the Ecopetrol Group as a leader in solutions adaptable to different requirements that contribute to the integration of energy markets and facilitate the transfer of knowledge.
- iv) To leverage the reduction of emissions in our operations (Scopes 1 and 2) and those of our clients (Scope 3), by acting firmly in the mitigation and reduction of climate change effects.
Performance
During 2022, the gas and LPG business delivered solid financial results with an EBITDA generation of more than 1.0 BUSD, representing a growth of ~30% compared to 2021 and an EBITDA margin of more than 50%. This, as a result of the increase in production of both products and the execution of commercial gas strategies focused on protecting the customer base and expanding into new markets in Colombia, which led to the renewal of 100% of the contracts during the gas trading process of larger fields. Similarly, the gas portfolio was strengthened with the discoveries of new fields in the Colombian Caribe, Uchuva-1, and Gorgon-2.
In order to develop businesses with a social conscience, in 2022 we executed the necessary activities to connect 13,447 [10] families in rural communities in the departments of Arauca, Casanare, Antioquia, Santander, Atlántico, Norte de Santander, and Meta, benefitting more than 24,000 families since the inception of this program in 2019. Also, the first micro LNG import pilot was successfully conducted, covering roughly 60% of demand in the Buenaventura District with imported natural gas. With regard to LPG, the price applied by Ecopetrol during the first half of 2022 generated benefit/savings in the amount of ~42 MUSD.
Energy Management
In the energy management business, the Ecopetrol Group was able to fulfill its energy efficiency goal in advance, with a 3% reduction in electricity demand by 2022. Since 2018, electricity demand has been optimized by 44.7 MW, representing an improvement of 5.5%. By 2022, the Group’s operations had achieved a reduction of 16.8 MW, mainly through the incorporation of good operating control practices in the midstream – such as optimizing the number of pumps to be used in a pumping station – and downstream segments – with optimizations in the electric pumping systems -, and the implementation of technological improvement initiatives with a high impact on the optimization of the electrical energy demand in the upstream, such as the installation of new horizontal pumping systems, improvements in the hydraulic networks, and nanotechnology in the water disposal and injection processes of the Rubiales field, and the reduction of losses in the electrical transmission lines in the Orinoquía Regional Vice Presidency.
Given the acquisition of 51.4% of ISA, and considering that there are regulations that establish restrictions on the vertical integration of generators, distributors, and traders, or companies that are vertically integrated and jointly undertake more than one of these activities, Ecopetrol began the divestment process in Ecopetrol Energía and the process for hiring the new energy trader, which will serve the Ecopetrol Group’s commercial lines until December 2036. The selected agent was Gecelca S.A. ESP, to whom Ecopetrol Energía’s long-term energy supply contracts were assigned as of September 1, 2022. This transition took place in accordance with the deadlines established by regulation and with no operating impact on any of the assets.
Furthermore, energy supply contracts were renegotiated, representing 14% of the non-regulated energy (ENR, as per its Spanish acronym) purchased for the Ecopetrol Group’s portfolio. The PPI indexer was limited to a maximum variation of 15.5% per year for 2022, and the energy supply price was renegotiated with a decrease in opex starting 2023.
Renewable Energies
In the case of the renewable energy business, Cenit acquired the 4.3 MW Cantayus small hydroelectric plant (PCH, as per its Spanish acronym) in 2022, which began delivering energy to this Company’s Cisneros station. Similarly, the 26 MW Brisas Solar Ecopark in Huila came into operation and 65 MW of solar energy was purchased 15 years out. These three (3) projects began supplying energy to the Ecopetrol Group in December and closed the year with a cumulative incorporation of 208 MW of non-conventional renewable energy into its self-generation matrix, with an incorporation of 96 MW in 2022.
In addition to the projects that came into operation during the year, the construction of solar ecoparks began in the Cartagena refinery (23 MW), as well as La Cira (56 MW) and Cenit’s solar farms (23 MW), which will come into operation in 2023. The Castilla, San Fernando, and smaller solar ecoparks achieved a reduction of 17.9 kTonCO2e and savings exceeding 13 BCOP.
Hydrogen
In 2022, the pilot project for the production of green hydrogen was successfully conducted using a 50kW pilot electrolyzer powered by solar energy at the Cartagena refinery, with a production of 20kg H2/day and an investment of approximately 1 MUSD. This pilot began in March and lasted six (6) months. The results will serve as the basis for the next steps in the development, implementation, and strengthening of the Company’s strategic hydrogen plan. The electrolyzer is currently located at Esenttia’s facilities.
On the other hand, partnerships with six (6) international companies were established in May: Total Eren and EDF from France, Siemens from Germany, H2B2 from Spain, Empati from the United Kingdom, and Mitsui from Japan, to consolidate the development of the strategic hydrogen plan as follows:
- i) Creating value to achieve cost competitiveness in hydrogen production by ensuring timely access to technology and low-cost renewable energy sources.
- ii) Structuring financing and investment opportunities for the projects in the portfolio.
- iii) Generating demand through the identification of markets and off takers in early stages.
In terms of own operations, the development of two (2) green hydrogen megaprojects remains, with a 60 MW electrolysis capacity, for a production of 9 ktonH2/year each, of which 60% will be used for consumption in the refineries and the remaining 40% for the production of hydrogen derivatives. In 2022, the first phase of the maturation model was approved for both megaprojects, which then continued to phase 2. The investment decision for these projects will be made in the fourth quarter of 2023 and the commissioning would take place in 2025.
Movilidad sostenible
In terms of sustainable mobility, the company is working on a comprehensive sustainable program involving alternatives both for the Group’s operations as well as the generation of partnerships with third parties for the incorporation of new mobility options in the country. Some of the actions adopted for Ecopetrol’s operations include a portfolio for workers, ranging from electric vehicles and bicycle rental, technological applications, and analytics to promote the efficient and shared use of vehicles, to the incorporation of electric and gas vehicles for the personnel to travel to the different areas in the country and for the operation of own fuels. A total of 248 vehicles have been incorporated to date, 87 in 2022, which represents 25% of the total fleet used by the Ecopetrol Group.
In terms of partnerships with third parties, a 3-year agreement was entered into between Ecopetrol and Automotores Toyota Colombia S.A.S. to conduct mobility tests in a green hydrogen vehicle at the first Caribe Innovation and Technology Center in Cartagena. Similarly, the first sustainable land mobility pilot is being developed together with FENOGE (Fund for Non-Conventional Energies and Efficient Energy Management) and Fanalca, consisting of the replacement of fossil sources with green hydrogen for the promotion and advancement of efficient energy management, in combination with Bogotá’s Integrated Public Transportation System (SITP).
Additionally, a memorandum of understanding was signed with 12 companies from the gas and financial sectors to structure a financing scheme of up to 75% of the purchase value of new heavy-duty vehicles running 100% on natural gas. The initiative known as the Kandeo program seeks to finance the acquisition of approximately 4,000 vehicles in the first three (3) years. The investment for the financing of this program is estimated at ~800 BCOP, of which Ecopetrol will contribute ~60 BCOP. This project will allow the reduction of more than 220,000 tons per year of CO2 and the objective is to generate new demand for natural gas.
CCUS
In 2022, the roadmap and the work plan began to be designed for the subsoil characterization of EOR-CO2 (Enhanced Oil Recovery) technological alternatives, dedicated geological storage, and in depressurized reservoirs. Six (6) pre-feasibility studies were conducted with different consultants (SLB, HATCH, SPROULE, BEICIP) to estimate CO2 storage capacity and potential for incremental production with improved recovery.
Total Investments in 2022
Detailed monitoring of gas and LPG investments began as of 2021, previously included under exploration and production. Investments made in 2022 amount to 539 MUSD, close to 12% of the Group’s investments for 2022, and represent an increase compared to the 232 MUSD invested in 2021. With regard to the Company’s subsidiary, Invercolsa, investments in the amount of 10.2 MUSD were made in 2022, representing a 21% increase compared to the investment of 8.4 MUSD in 2021.
Investments in gas exploration and production projects have shown a growing trend in recent years and are mainly concentrated in Piedemonte, the Caribe offshore and onshore, and in the Permian account, outside of Colombia. In terms of activities, the investment focused on the profitable growth of the gas business in current assets, on ensuring the future commitment to offshore, and on guaranteeing infrastructure investments, while ensuring the reliability, integrity, and continuity of the operation.
Investments in renewable energy and hydrogen accounted for ~ 60 MUSD by the end of 2022; 29 MUSD represented in investments in the La Cira solar ecoparks, the refineries of Cartagena and Barrancabermeja, Quifa, and Casabe and Cantagallo; as well as hydrogen (H2) and small hydroelectric plants (PCHs), among some of the most important projects. Cenit’s acquisition of the Cantayus PCH represented ~10 MUSD and the investment in the construction of the Brisas solar ecopark by partner AES, through the PPA scheme (Power Purchase Agreement), amounted to ~21 MUSD.
Business Results
In volumetric terms, gas and LPG sales showed an increase of close to 6% compared to 2021.
Natural gas demand covered by Ecopetrol grew by 40 GBtud (10% of the goal set for 2030). Similarly, the market share increased from 79% to 80%.
With the update of long-term portfolio projections, volumes increased by 2% in the strategic plan scenarios defined in 2021.
The Ecopetrol Group’s reduction of equivalent GHG in 2022 stood at 416,672 Kton CO₂, including 156 Kton CO₂ of energy efficiency, 9 Kton CO₂ of renewable energy, and 251 Kton CO₂ related to flaring, leaks, and venting.
With respect to renewable energies, 208 MW were incorporated at the end of 2022, including 95 MW purchased from the grid, in the Ecopetrol Group’s self-generation matrix, thanks to the commissioning of three (3) projects
in 2022, one (1) PCH and two (2) photovoltaic solar projects.
The management of subsidiary Invercolsa in 2022 recorded sustained growth in its financial results, with an EBITDA generation of 490 BCOP as of December 2022, +13.4% compared to the previous year, with levels similar to the periods prior to the pandemic, mainly due to:
- i) Higher profitability per m3 and higher volumes of natural gas.
- ii) The opening of the market in 2021, as well as revenue increases from installations and transportation due to the higher levels of activity.
Liquefied Natural Gas (LNG)
Liquefaction Capacity
The Ecopetrol Group does not have natural gas liquefaction capacity or infrastructure to date. A micro LNG pilot is currently being executed in Buenaventura (Valle del Cauca), consisting of LNG importation and small-scale regasification (~320 BBTUD). The incursion into liquefaction projects is considered in the future, which will depend, among other circumstances, on the exploratory success of offshore projects to allow natural gas surpluses that can be liquefied for export purposes after covering domestic demand; however, these alternatives are still in the preliminary evaluation stage and participation in liquefaction terminals has not yet been confirmed.
III.4.3. Transmission and Toll Roads Business Line

This includes the electricity transmission, toll road infrastructure, and telecommunications businesses, with the purpose of enhancing their performance and capturing synergies with other business lines, maximizing the value of these types of businesses, which are characterized by developed and implemented operating models and regulated returns.
ISA, under the Ecopetrol Group, is a multi-latin company with more than 55 years of experience and track record, operating in the electric power, toll roads, and telecommunications and ICT businesses, and contributing to the quality of life of millions of people in Colombia, Brazil, Chile, Peru, Bolivia, Argentina, and Central America through the work of its 4,713 employees in its 51 companies.
ISA undertakes its business based on technical excellence, the efficient provision of services, the creation of sustainable value for its Stakeholder Groups and for society as a whole, based on best corporate governance and ethical practices.
ISA and its companies are committed to mitigating and adapting to climate change, the rational use of resources, the development of programs that generate a positive impact on the environment, the comprehensive development of the communities where it operates, and the quality, reliability, and availability of the services it provides.
After more than five decades of leadership in the region, ISA has transcended the physical act of connecting one point with another to connecting people and making each connection an inspiring act.
Overall Figures
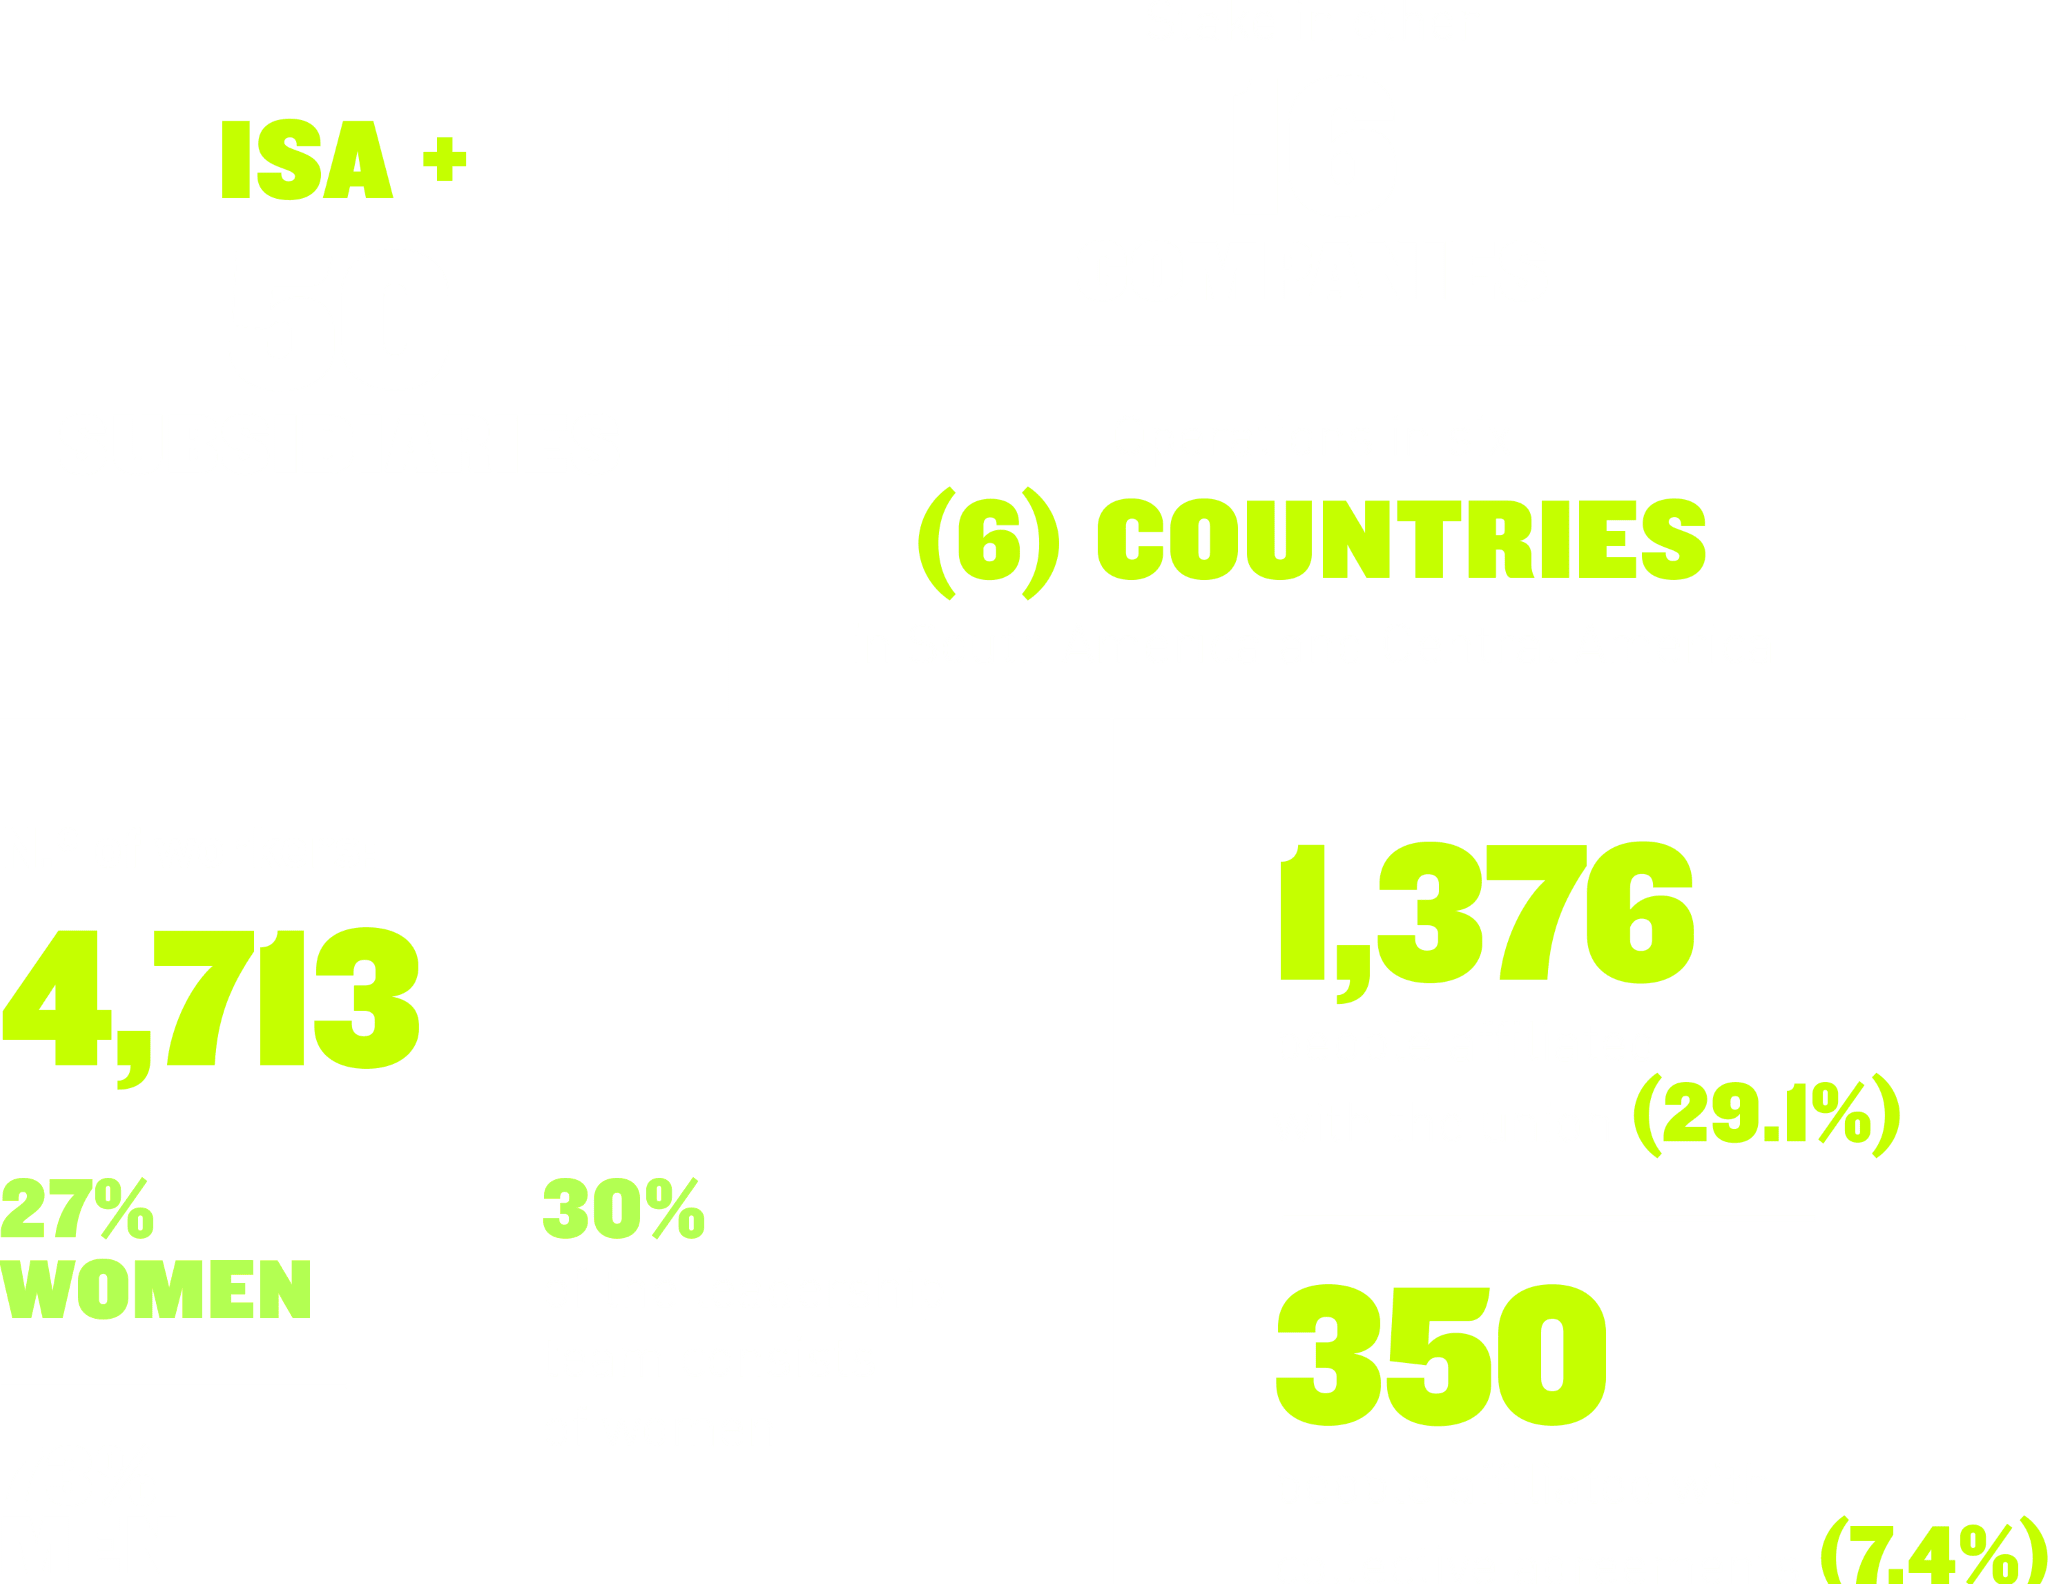
| Energy: 48,766 km and 104,438 MVA of transmission infrastructure in operation. |
|---|
| Energy: 69,934 km and 135,526 MVA, including ISA’s stake in other companies. |
| Energy: 7,048 km and 20,237 MVA of transmission infrastructure under construction. |
Toll Roads: 860 km of highways in operation. 714 km in Chile, 146 km in Colombia. Due to the conclusion of the Ruta del Bosque concession, there will be 553 km in operation in Chile and 146 km in Colombia as of February 2023, for a total of 699 km. |
| Toll Roads: 136 km of highways under construction. |
| XM: Coordination of the operation and administration of the Colombian electricity system market. |
| Internex: 56,463 km of fiber optics in operation and 1,087 customers. |
ISA has been a member of the Dow Jones Sustainability Index for eight consecutive years, and it is included in the Sustainability Yearbook for the sixth year. Additionally, in 2022, it remained in the Dow Jones Sustainability Index MILA Pacific Alliance for the fifth consecutive year.
ISA was recognized with the quality seal granted by the Colombian Stock Exchange for its transparency, corporate governance, and commitment to the stock market for the sixth consecutive year.
In 2022, it was also awarded the Empresa ALAS20 recognition in Colombia.
| Consolidated financial figures (trillion COP) | 2022 | Variation % 2022 vs. 2021 |
|---|---|---|
| Operating income | 13.4 | 19.7 |
| Net profit | 2.2 | 32.2 |
| EBITDA*** | 8.6 | 11.3 |
| EBITDA margin | 64.1% | -7.1 |
| Assets | 78.7 | 27.6 |
| Liabilities | 49.2 | 24.3 |
| Separate financial figures (trillion COP) | 2022 | Variation % 2022-2021 |
|---|---|---|
| Net profit | 2.2 | 32 |
| Figures by business (trillion COP) | Income** | % | EBITDA*** | % | Assets | % |
|---|---|---|---|---|---|---|
| Electrical energy*: | 10.0 | 74.9 | 6.8 | 79.4 | 62.5 | 78.8 |
| Toll Roads | 2.9 | 21.5 | 1.6 | 18.5 | 15.1 | 19.2 |
| Telecommunications and ICT | 0.5 | 3.6 | 0.2 | 2.1 | 1.1 | 2.0 |
| Total | 13.4 | 100 | 8.6 | 100 | 78.7 | 100 |
* EBITDA restated since 2018 due to methodological approval with Ecopetrol. This EBITDA is defined as profit from operating activities plus
operating taxes, plus depreciation, amortization, and impairment of non-financial assets.
** Includes income from the periodic tariff review in Brazil.
*** Electrical Energy includes XM.
Conexión Jaguar Program
Conexión Jaguar is the sustainability program adopted by ISA and its companies to contribute to the conservation of biodiversity, the mitigation of climate change, the development of rural communities, and the connectivity of the jaguar’s (panthera onca) natural habitats in Latin America. Chile, on the other hand, focuses on the protection of the puma’s (Cougar Concolor) natural habitat since they do not have jaguars in that country. The program provides technical and financial support so that the best forest initiatives, in the hands of rural communities, issue and market certified carbon credits, under the highest international standards for the financing of conservation.
The Program seeks to contribute to the fulfillment of the global goals established in the 2030 agenda, such as the Paris Agreement, the Biodiversity Agreement, and the Sustainable Development Goals, specifically goals 13, 15, and 17: Climate Action, Life on Land, and Partnerships for the Goals.
Results in Latin America
Nine (9) ongoing projects, five (5) in Colombia, two (2) in Peru, one (1) in Brazil, and one (1) in Chile.
More than 820 thousand hectares with conservation or restoration actions.
Emission reduction potential of more than seven (7) million tCO2e (between 2013 and 2055).
Improvement of soil and water conditions.
Various activities to support 322 families in Colombia, Peru, and Brazil.
Record of more than 180 fauna species in the camera traps placed in the project areas, of which 14 are cataloged under some degree of threat, according to the International Union for Conservation of Nature (IUCN).
Recognitions:
1
El Espectador BIBO Award
Commitment to a Sustainable and Healthy Habitat Category
2
Portafolio Awards
Environmental Protection Category
3
Boscares Award in Peru
Forests and Climate Change Category
4
ProActivo 2022 Award in Peru
Energy Category
(ECP015)
Supply Chain
Sourcing Model
and Strategy
Goods and services at Ecopetrol are procured through a strategic model based on cross-cutting and enabling supply, with the purpose of ensuring the effective, responsible, and sustainable supply of goods and services in the long term, with segmented costs, opportunities, performance, quality, and level of risk, thanks to the efforts of trained and motivated human talent, and in an organizational and technological environment guided by best practices.
The sourcing strategy involves five (5) capacities:
Demand, inventory, and logistics management:
Articulation between investment and supply plans to maximize value generation in the supply chain, migrating to a predictive demand model to ensure the optimal level of inventory and service opportunity.
Business models:
Development and implementation of commercial instruments with the main suppliers for the implementation of innovative and efficient initiatives, focusing on standardization, long term perspectives, and the life cycle cost.
TESG:
Development and improvement of local and regional capacities, considering the productive vocations of the regions in which Ecopetrol S.A. operates, considering supply strategies and contractual and market practices aligned with the environmental agenda.
Technology and Innovation:
Improving supply chain efficiency through technology, analytics, and 4RI capabilities, as well as migration to the cloud, in accordance with the digital transformation roadmap.
Smart market management:
Decision-making based on simulation of probable scenarios, drawing from the analysis and monitoring of risks and
market variables.
The effectiveness of the model is measured by strategic coverage and value generation, indicators that focus on leveraging organizational goals. Similarly, metrics have been incorporated to ensure the sustainable management of the supply chain, such as the local hiring of labor and procurement of goods and services, diversity and inclusion, diverse productive ventures, and decarbonization.
The model does not apply to the trading of raw materials and products, energy management, comprehensive logistics solutions, financial operations, new businesses, or the management of agreements and sponsorships, given that these areas already have specific processes.
Total Procurement
at Ecopetrol S.A.
The Company contributes to economic reactivation from the supply function by increasing the procurement of the necessary goods and services to leverage corporate goals. In 2022, Ecopetrol increased the procurement of goods and services by 47%, this being the highest since the transformation of the supply model in 2017, closing at approximately 24.7 TRILLION COP.
| Origin | 2018 | 2019 | 2020 | 2021 | 2022 |
|---|---|---|---|---|---|
| Nacional | 10,102,266,315,612 | 12,882,710,288,371 | 12,213,041,342,863 | 15,823,530,409,025 | 23,575,703,425,030 |
| Foreign | 338,376,995,881 | 486,974,439,366 | 756,651,341,559 | 1,044,413,202,432 | 1,144,809,406,978 |
| Total | 10,440,643,311,493 | 13,369,684,727,737 | 12,969,692,684,422 | 16,867,943,611,458 | 24,720,512,832,008 |
Nota: Las cifras incluyen contratación de Reficar..”]
Procurement as
a Lever for TESG
Supply management had implemented initiatives that contribute to the sustainable economic development of the territories, in a way that 86% of total labor associated with the contracts is hired locally.
Similarly, the inclusive employment strategy has been strengthened, offering more than 19,857 opportunities to people with disabilities, youth, ethnic groups, victims of armed conflict, and women. In terms of goods and services, the initiative to purchase from various productive entrepreneurs has been promoted, in order to contribute to the growth of MSMEs, by doing business in the amount 57,245 BCOP with more than 974 companies between 2020 and 2022, and generating 6,098 non-oil inclusive jobs (without exclusive dedication to Ecopetrol S.A.), benefiting more than 30,000 families.
In the environmental dimension, the supply chain has developed an environmental agenda focused on four (4) thematic areas since 2019: decarbonization, waste and materials, water and biodiversity, and two (2) cross-cutting lines: procurement, and information and technology, which became the vehicle to contribute to organizational goals.
71,970 tCO2e were reduced in the supply and services chain in 2022, which corresponds to 10% of the total baseline of emissions generated in this area. 34,176,254 kg of waste were sold, of which 94% was ferrous waste that was fully used in the steel industry, growing by 5% compared to 2021. 98% of ferrous waste was used with the management of the circular economy. The first supply circularity model was launched, which allowed the transformation of 173,462 kg of ferrous waste into 348 racks and 8 cantilevers, with a 100% circularity indicator, and also represented 401 MCOP in avoided costs. 3 BCOP were generated through the repurchasing of turbo machinery equipment with manufacturers, which are sold for remanufacturing purposes, thus extending the serviceable life thereof. 5,771 tons of waste from the administrative services categories were used, corresponding to 76.5% of the total waste generated in the operation.
With technology as the core, the supply function manages high-level expertise on macro trends, sectors, and industries through the prospective analysis of internal and external variables, framed under the co-creation of scenarios that support decision-making in negotiation and/or procurement strategies, generating solutions that transform the way in which procurement strategies are addressed.
The supply function seeks to guarantee the commitment to TESG by Ecopetrol suppliers, for which it incorporates sustainable criteria for the qualification, selection, and evaluation of suppliers throughout the process, in order to measure their commitment in these aspects. Some of these factors include:
Technical certifications, management systems, HSE, and compliance.
Promotion of local supply.
Local supply of goods and services.
Environmental criteria (decarbonization, waste, water, biodiversity, among others) to be evaluated in the selection methods and in the execution of the contracts.
Inclusive employment.
Supplier performance, evaluating their level of compliance with contractual obligations.
With the objective of strengthening the sustainable territorial growth of the country, supply management developed the Regional Impact Model for Ecopetrol’s operations in the areas of influence, based on six (6) dimensions:
- i) Production
- ii) Commercial links
- iii) Tax contributions
- iv) Generation of employment
- v) Increase in household income
- vi) Alignment of social investments with development plans
This model allows for:
- The quantification of the Company’s economic and social contribution in the territories where it operates by participating in aggregate indicators at the local level, as well as the indirect effects on external indices such as the Municipal Performance Measurement (MDM, as per its Spanish acronym) calculated by the National Planning Department (DNP) based on results, capacities, and management, which shows a variation of 51 to 57 points between the national result and that of the municipalities where Ecopetrol operates.
- The identification of future projects in municipalities with high potential for transformation where Ecopetrol’s activities can truly impact the quality of life of its inhabitants, thus strengthening sustainable territorial development.
- Simulations of production increases or decreases, or of new clean energy businesses in local economies.
- Guiding the dialogue with national authorities, including mayors and governors, with regard to social and economic benefits.
In terms of local procurement, Ecopetrol has designed a Strategic Plan for Goods and Services, Labor, and Various Productive Ventures that have contributed to the strengthening of local economies by promoting sustainable growth and boosting the competitiveness of suppliers, while sourcing products and/or services from the local market under the criteria of legality, transparency, plurality, competitiveness, reasonable prices, free and fair competition, and equitable inclusion.
Savings Generated
As a consequence of the economic situation faced by the industry, the supply function has not only focused on the development of competitive advantages but also on the generation of greater value, with the management of savings throughout the supply chain as one of the main mechanisms. An indicator has been established to this end, to measure the savings generated by supply strategies, contract renegotiations, and purchases, when applicable, as well as logistics management and inventory optimization, in addition to the income obtained by circular business models, austerity measures, and the optimization of goods and service purchases orders.
The evolution of the indicator and the percentage of compliance with annual goals are specified below:
| Year | Real | Goal | Compliance with the Goal | BCOP* |
|---|---|---|---|---|
| 2019 | 9% | 5% | 180% | 2,024 |
| 2020 | 9% | 8% | 112% | 2,590 |
| 2021 | 7.83% | 7.5% | 104% | 2,287 |
| 2022** | 7.1% | 5% | 142% | 2,639 |
* This amount includes savings for the year plus savings in previous periods that can be capitalized in the year (lags).
** Note explaining the decreasing target: an unusual inflationary scenario arose in 2022, with historical highs in different categories associated with the Oil & Gas industry and important increases in Producer Price Index (PPI), Consumer Price Index (CPI) for food products 27.8%, and a CPI of 13.12%. This inflationary environment impacted the direct cost of services, making it more difficult to generate savings in this environment of rising prices.
Since 2017, accumulated savings of more than 11.1 TRILLION COP have been recorded. In 2022, 1.455 BCOP were generated compared to the 24.7 TRILLION COP assigned; 58% of the savings (0.84 TRILLION COP) had an impact on CAPEX and 42% (0.61 TRILLION COP) corresponded to OPEX, in addition to the 1.058 BCOP in previous periods capitalized in 2022. Furthermore, 126 BCOP were generated in savings due to value generation initiatives, consisting of 56 BCOP in income from the sale of non-required goods, 37 BCOP in synergies with Ecopetrol Group companies, and 24.5 BCOP due to the digitalization of the process to improve contract execution.
Suppliers and Contractors
(GRI 2-6-b-ii)
(WEF 17)
Ecopetrol invites the companies and/or legal entities that are able to meet the specific needs to participate according to their magnitude or complexity. The bidders are chosen from different sources of information, such as market intelligence and the Ecopetrol Supplier Information System (SIPROE).
This functionality includes recruitment mechanisms to understand suppliers and contractors more in depth, looking into their legal, financial, and technical capacity, experience, and compliance with HSE requirements; this information is queried on 23 restrictive and control lists to identify findings or possible coincidences with counterparts and their related parties. Additionally, for each selection method and in accordance with the recruitment strategy developed, the bidders must comply with the specific requirements requested.
(GRI 2-6-b-ii, 2-13) (WEF 17)
| Year | 2018 | 2019 | 2020 | 2021 | 2022 |
|---|---|---|---|---|---|
| Number of contracts | 12,213 | 10,488 | 8,521 | 9,887 | 7,208 |
Note: The contracts managed correspond to goods and services contracts in force each year (celebrated, executed, or in the closing stage).
(GRI 2-6, 2-13) (WEF 17)
| Origin | 2018 | 2019 | 2020 | 2021 | 2022 |
|---|---|---|---|---|---|
| Nacional | 3,575 | 3,660 | 3,264 | 3,285 | 3,281 |
| Foreign | 242 | 266 | 216 | 269 | 272 |
| Total | 3,817 | 3,926 | 3,480 | 3,554 | 3,553 |
With regard to the procurement of goods and services, in 2022, the Company had 4,379 suppliers authorized in SIPROE in the different goods and service categories required. A total of 7,208 contracts and 3,553 contractors were managed, 92% of which correspond to contracts with domestic suppliers and the remaining 8% to contracts with foreign suppliers.
Local Recruitment by Contractors
44,939 contractor workers were reported as of December 2022, dedicated exclusively to the activities hired by Ecopetrol S.A., 86% of which (38,841 workers) correspond to local labor in the regions where the Company operates.
| Number of workers distributed according to origin | 2019 | 2020 | 2021 | 2022 |
|---|---|---|---|---|
| Local* | 29,462 | 28,579 | 35,948 | 38,841 |
| Non-local** | 6,249 | 5,385 | 5,495 | 6,098 |
| Total workers | 35,711 | 33,964 | 41,443 | 44,939 |
| Percentage of employment of local workers | 83% | 84% | 87% | 86% |
*Local labor: person accrediting his/her residence with the certificate issued by the municipal mayor’s office.
**Non-local labor: workers residing in other regions of the country. Should the required workforce not be available in the municipality where the projects are being developed, the necessary labor will be recruited from neighboring municipalities.
(GRI 2-13, 413-1, 11-15-2) (WEF 17)
| Region | Year | |||
|---|---|---|---|---|
| 2019 | 2020 | 2021 | 2022 | |
| Caribe – Pacific | 1,208 | 3,416 | 3,952 | 4,001 |
| Female | 169 | 370 | 464 | 514 |
| Male | 1,039 | 3,046 | 3,488 | 3,487 |
| Central | 15,205 | 15,409 | 18,673 | 18,980 |
| Female | 3,787 | 3,682 | 4,614 | 4,771 |
| Male | 11,418 | 11,727 | 14,059 | 14,209 |
| Oriente | 4,614 | 3,950 | 6,854 | 8,058 |
| Female | 640 | 528 | 825 | 1,015 |
| Male | 3,974 | 3,422 | 6,029 | 7,043 |
| Orinoquía | 11,401 | 8,478 | 9,360 | 11,190 |
| Female | 2,104 | 1,629 | 1,968 | 2,448 |
| Male | 9,297 | 6,849 | 7,392 | 8,742 |
| South | 3,283 | 2,711 | 2,604 | 2,710 |
| Female | 554 | 478 | 507 | 529 |
| Male | 2,729 | 2,233 | 2,097 | 2,181 |
| TOTAL | 35,711 | 33,964 | 41,443 | 44,939 |
In terms of the prioritization of local labor, Ecopetrol acts in accordance with Colombian legislation when undertaking hydrocarbon exploration and production projects, which provides for the employment of 100% of unskilled labor and minimum 30% of skilled labor. To learn about the detailed evolution of local labor hired by contractors, in accordance with Decree 1668 of 2016, visit the Ecopetrol website or click here.

Ecopetrol was granted two (2) recognitions for the implementation of the inclusive employment policy:
- ANDESCO GRAND SUSTAINABILITY PRIZE – LARGE COMPANIES,
awarded to companies with outstanding practices in six aspects:- i) Market – Diverse Productive Ventures
- ii) Social
- iii) Labor – Generation of Employment
- iv) Corporate Governance
- v) Environmental
- vi) Best Inclusion Practices
- 2022 VI IBEROAMÉRICA INCLUYE AWARD, granted by the Ibero-American Network of Inclusive Companies and the Ibero-American Social Security Organization (OISS). This award recognizes the work of companies that contribute to improving the quality of life of people with disabilities and their participation in employment. It values creativity, innovation, and leadership in corporate labor diversity policies.
Ecopetrol, by means of its internal labor regulation applicable to hired activities, establishes the labor standards to be met by all suppliers when conducting activities for the company. This policy emphasizes on the commitment to respect all human rights, with special consideration of the supply chain:
- Dignified, favorable, and adequate working conditions.
- Freedom of union affiliation and collective bargaining.
- Equal employment and occupation.
- The abolition of any form of child labor.
Ecopetrol’s main strategies continue to promote the “Labor Inclusion” of people of difficult placement in the activities hired, thereby contributing to the consolidation of fundamental pillars such as equity, equality, and the right to work. In 2022, with the inclusive employment strategy (VLI, as per its Spanish acronym), contractors recruited 19,857 workers of difficult job placement, including 16,237 women, 143 people with disabilities, 1,678 people starting their first job, 1,322 people from ethnic minority groups, and 477 victims of armed conflict.
| LABOR-RELATED GOAL | Inclusive employment (VLI) 2021 | Inclusive employment (VLI) 2022 |
|---|---|---|
| GOAL | 15,310 people | Increase the annual accumulated VLI percentage to 22% |
| REAL | 16,622 people VLI / 78,721 = 21% | 19,857 people VLI / 88,801 = 22.4% |
| % OF COMPLICANCE WITH THE GOAL | 109% | 102% |
Local Procurement of Goods and Services
In accordance with Ecopetrol’s operating supply model and the applicable regulatory regime, the allocation of contracts takes place within the framework of a selection method, as established in the Company’s Procurement Manual, and it similarly provides for the local procurement of goods and services in the areas where the Company operates, for which it has implemented a local goods and services strategy to promote sustainable growth and the competitiveness of local suppliers in the market.
In 2022, local goods and services were procured in the approximate amount of 4.6 TRILLION COP from suppliers in the municipality or department where the contract is executed, representing 67% of the total potential procurement11 by Ecopetrol12 and its partners.
12 The calculations of local procurement by Ecopetrol S.A. are based on the analysis and measurement of categories with local potential instead of regional.
| Local Procurement and Business Environment | 2019 | 2020 | 2021 | 2022 |
|---|---|---|---|---|
| (A) Local Procurement and from the Business Environment | 7,299,754,112,650 | 6,209,468,442,326 | 8,413,035,379,158 | 11,640,437,310,281 |
| (B) Procurement from the Rest of the Country | 5,582,956,175,721 | 6,003,572,900,536 | 7,410,495,029,867 | 11,935,266,114,750 |
| A+B Procurement | 12,882,710,288,371 | 12,213,041,342,863 | 15,823,530,409,025 | 23,575,703,425,030 |
| Percentage of Local Procurement | 57% | 51% | 53% | 49% |
Note 1: The figures include Reficar’s procurement and contracts executed in Bogotá.
Note 2: Local procurement: procurement of goods and services from suppliers registered in the municipality where the contract is being executed.
Note 3: Procurement from the business environment: procurement of goods and services from suppliers registered in other municipalities in the department where the contract is being executed.
Note 4: Total local procurement: local procurement + procurement from the business environment.
Local Procurement Indicator
The objective of this indicator is to measure the impact that both Ecopetrol and its contractor partners have on the procurement of local goods and services in the territories where they operate, in order to increase the participation of local suppliers in the supply chain.
The evolution of the indicator is specified below in terms of the goals set per year, the fulfillment thereof from 2019 to 2022, and the calculation premises for each of the periods:
| Local Procurement Goal | 2019 | 2020 | 2021 | 2022 | |
|---|---|---|---|---|---|
| Ecopetrol | 38% | 25% | 57% | 65% | |
| Partners | 15% | 46% | |||
| Results | Ecopetrol | 57% ($7,299 mM) | 34% ($1,549 mM) | 70% ($4,194 mM) $ 2,570 mM Ecopetrol + $1,624 mM Partners | 67% ($4,577 Mm) $3,170 mM Ecopetrol + $1,407 mM Partners |
| Partners | 47% ($2,422 mM) | 54% ($1,508 mM) | |||
| Percentage of Compliance | Ecopetrol | 150% | 136% | 123% | 103% |
| Partners | 313% | 117% | |||
Notes regarding the evolution and calculation premises of the Indicator (if applicable):
Goal does not include procurement from foreigners, the Business Group, or reimbursable expenses.
From foreigners, the Business Group, and reimbursable expenses, as well as contracts executed in Bogotá.
For Ecopetrol, the categories and subcategories without local supply available were excluded from the denominator.
The goal is consolidated for Ecopetrol and its Partners. The measurement is taken with respect to Ecopetrol’s local procurement potential + total procurement by the partners. The goal is consolidated for Ecopetrol and its Partners. The measurement is taken with respect to Ecopetrol’s local procurement potential + total procurement by the partners. Ecopetrol’s local potential is updated and characterized according to the local offer available by region.
Notes:
- Figures from the First Link as of December 31, 2022.
- In the period between 2019 and 2022, the premises for calculating the Local Procurement Indicator have been evolving and adjusting so that Ecopetrol’s impact on the procurement of local goods and services in the regions where it operates can be measured more accurately. In 2021, the Company migrates to an analysis to identify the goods and services with the potential of being procured locally (local potential) in order to deploy actions to promote the local procurement of these lines. The indicator and its respective measurement respond to the procurement behavior of these lines of goods and services.
- The partners began to measure local procurement in 2018, for which they set a goal in terms of increase compared to the previous period and with the purpose of setting a baseline for 2019. In this sense, local procurement goals were set in percentage terms as of 2019 for both Ecopetrol and its partners.
Diverse Productive Ventures Program
For three years, Ecopetrol has promoted the Diverse Productive Ventures
(EPD, as per its Spanish acronym) program to contribute to the economic growth
of MSMEs, generating opportunities for the consolidation and growth of more than
976 companies and the materialization of business deals in the amount of 57.245 BCOP, thus contributing to the generation of more than 6,098 inclusive, non-oil jobs (without exclusive dedication to Ecopetrol) and benefiting more than 30,000 households.
Development of Local Suppliers
In 2022, Ecopetrol contributed to the development of local suppliers by training them on social media and digital marketing, advertising, marketing, green businesses, business leadership, innovation and technology, energy transition, among others. Furthermore, the Emprende con Energía School was established, which contributed to the closing of business gaps for micro, small, and medium-sized entrepreneurs (MIPYMES), with instructors from different entities, suppliers, and champions of Ecopetrol S.A.’s Diversity and Inclusion Program.
Supplier Segmentation
Supplier segmentation seeks to capture value in the supply process, in contribution to the 2040 Strategy, by strengthening interactions with suppliers, optimizing costs, and identifying and defining new strategies and opportunities.
Based on international standards, the supplier segmentation process was strengthened in 2022 through the analysis of two (2) new criteria: supplier performance and strategic potential, totaling five (5) criteria for classification:

With this new methodology, Ecopetrol went from classifying its suppliers from four (4) to nine (9) quadrants, distributed in the three (3) hubs listed below:
Key suppliers:
Those with potential for innovation and technology, with whom the Company seeks to develop a set of goods and services, establish long-term relationships, and generate investments to be more competitive.
Suppliers to be strengthened:
Suppliers that the Company will work with to increase and improve their performance and maximize their added value.
Challenging suppliers:
Low-performing suppliers that require more support to maximize their opportunities for improvement in the chain and ensure their operating continuity.
3,345 Ecopetrol suppliers with valid contracts as of December 31, 2021, were segmented in 2022, and differentiated engagement strategies were established for each segment to maximize added value in accordance with the new segmentation methodology. These strategies will be developed throughout 2023 under the framework of the supplier engagement plan.
Engagement with Suppliers
A hybrid (virtual and in-person) supplier engagement plan was designed in 2022. The main activities conducted with suppliers in 2022 include the following:
- (i) Supplier Summit, for the first time, as the Ecopetrol Group.
- (ii) First TESG Congress.
- (iii) Somos Colombia Roundtables.
- (iv) Diversity and Inclusion in the Supply Chain, among others.
(GRI 414-2) (ECP 016)
Supplier Performance Evaluation
Ecopetrol’s supply chain process defines any event or action with negative impacts on economic growth and social well-being as being of high risk for TESG. For this reason, the Company monitors and evaluates critical environmental, social, and economic aspects to ensure harmony in its operations and reduce TESG risks.
Ecopetrol has designed a methodology and different criteria to conduct its supplier performance evaluation to ensure the proper execution of contracts and objectively establish long-term commercial relationships. The criteria appraised include operational efficiency, compliance with deadlines, labor, commercial, and administrative aspects, and environmental management, in order to identify potential social impacts and HSE indicators leading to opportunities for improvement
in occupational health and safety and environmental protection.

Note: Below is the historical evolution of the cross-cutting criteria for performance evaluation (administrative aspects, management of the environment, and HSE).
(ECP 013) (SFC X)
Ethics, Transparency, and Compliance
in the Procurement Process
Ecopetrol requires its contractors, workers, and their related companies to strictly comply with ethical principles and regulations on the prevention of conflicts of interest and ethics, fraud, corruption, bribery, money laundering, financing of terrorism, and free competition practices.
All Ecopetrol contractors declare that they are aware of and comply with the obligations of ethics, transparency, and compliance in the procurement process, which are a key part of the contract minutes and include the following, among others: Code of Good Governance, Code of Ethics and Conduct, anti-bribery laws, accounting standards, and implementation of internal control mechanisms.
Supply management has established a reinforced framework with high standards of ethics, transparency, and due diligence, leveraged on three (3) fundamental pillars:
| Pillar | DeDue diligence | Ethics | Transparency |
|---|---|---|---|
| Mechanisms |
|
|
|
Promotion of Procurement
Mechanisms
Ecopetrol promotes the procurement of goods and services by means of the following mechanisms:
Web page:
www.ecopetrol.com.co/ which contains a special section for suppliers and contractors informing them about the regulations and the main changes in the supply function.
Supplier Portal in SAP:
consisting of the SIPROE-SLC, SRM, and SUS modules, where suppliers and contractors present their goods and services portfolio, received electronic offers, and store contractual execution documents.