Environment

1
2
3
4
5
6
7
8
Investments and
environmental expenses
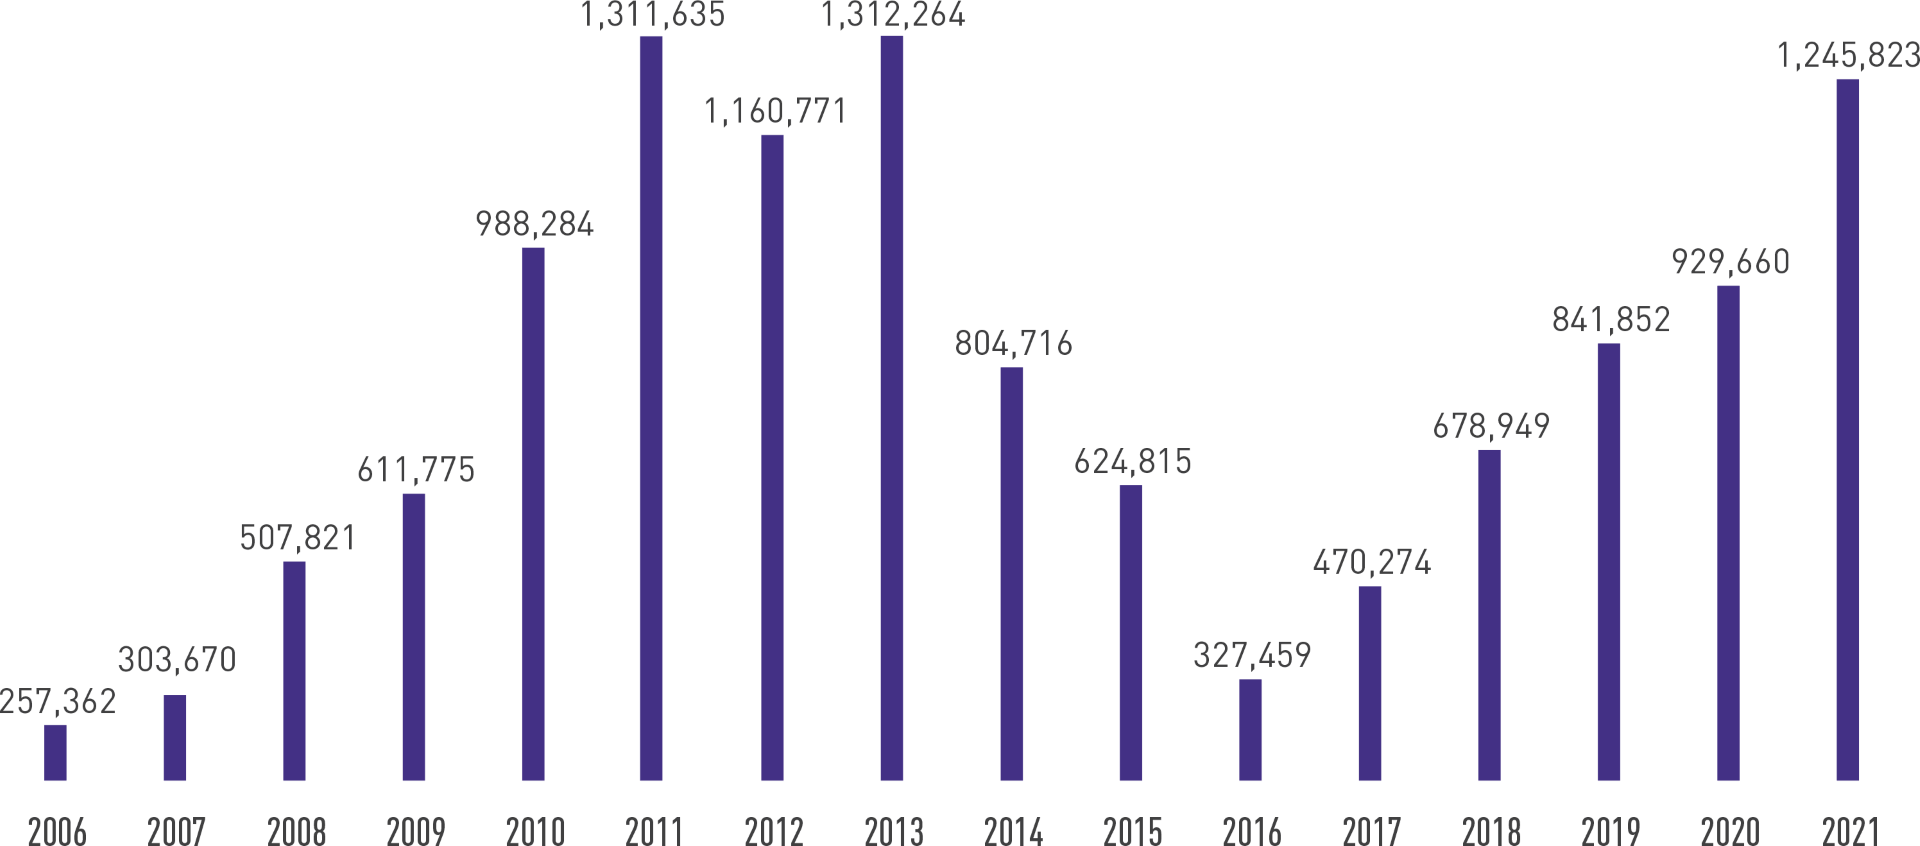
COP 1.2 trillion
in environmental management,
increase of 25%
Environmental investments and expenses at Ecopetrol S.A. (Millions of pesos)
COP 116,089
billion
mainly allocated to environmental activities, environmental education, the dissemination of environmental activities, the hiring of environmental management personnel, environmental studies, and legal procedures, as well as the operation and maintenance of equipment and monitoring networks.
COP 35,950
billion
billion for the management of natural water resources, allocated to related recovery and protection programs, the purchase and assembly of equipment to control and monitor the quantity and quality of surface and/or underground water resources, and the protection of water basins.
COP 21,703
billion
for the recovery and protection of forests.
COP 271,473
billion
for the recovery and protection of natural air resources, allocated to the acquisition of equipment and the development of productive technologies to reduce atmospheric emissions.
COP 223,582
billion
for the recovery and protection of soil natural resources, allocated to the management and physical works for soil protection (geotechnical protection measures).
COP 15,159
billion
in biodiversity, allocated to biodiversity preservation and conservation projects.
COP 450,367
billion
in drinking water and basic sanitation, allocated to wastewater treatment projects, construction and implementation works for drinking water supply, and the management and disposal of solid and hazardous waste.
COP 111,646
billion
in risk management, allocated to disaster prevention management and support in disaster response.
Environmental
planning and compliance
Ecopetrol S.A. currently holds
402 environmental authorizations
issued by national and regional environmental authorities, distributed as follows:
Environmental authorizations issued
| Business segment | Environmental Licenses / Environmental Management Plans / Environmental Management Measures | Permits for the use and exploitation of natural resources |
|---|---|---|
| Exploration | 53 | 3 |
| Production | 111 | 219 |
| Refining | 3 | 9 |
| Other | 0 | 4 |
In 2021, Ecopetrol received 3,680 administrative acts issued by the Environmental Authorities, of which 1,548 contained systematic monitoring requirements at the strategic, tactical, and operational levels to ensure timely compliance with the obligations set forth by said authorities.
Prior to managing and obtaining environmental authorizations, Ecopetrol S.A. conducts activities to understand and diagnose environmental aspects and determinants during the project planning stage. Thus, it identifies the potential environmental impacts and the essential opportunities to design and plan the environmental management measures established based on the mitigation hierarchy.
The following environmental authorizations were obtained in 2021
- 18 environmental authorizations from ANLA by means of the legal channel known as minor changes.
- One (1) Environmental License issued by ANLA for “the construction and operation of the Vasconia – Teca gas line”.
- One (1) Modification of the Environmental License under Resolution 1257 of 2015 for Exploratory Drilling Area VMM32.
- Two (2) Modifications of Comprehensive Environmental Management Plans (PMAI, by its Spanish acronym) under the projects “Inclusion of gas variant 4”, “Sogamoso Yariguí – Cantagallo Bridge,” and “Pilot plan for water injection and wastewater disposal at the Palagua field”.
- One (1) Subtraction of the Magdalena River Forest Reserve, created by Law 2 of 1959, for the “Yariguí 3D Seismic” project.
- One (1) establishment of environmental management measures for the Apiay – Chichimene transfer line.
- 53 environmental authorizations were obtained from Regional Autonomous Corporations (CAR, by its Spanish acronym) for the use and exploitation of natural resources at Ecopetrol S.A. fields.
In addition, 132 procedures were managed and filed with the Regional Environmental Corporations (CAR for its Spanish acronym), the Ministry of Environment and Sustainable Development, and ANLA.
Compensation for the use of natural resources and
compulsory investment of not less than 1% in the water basins
subject to capture
Compliance with environmental obligations arising from the use and exploitation of natural resources and the collection of water from watersheds is established in control and monitoring instruments (environmental licenses, environmental management plans, and environmental permits).
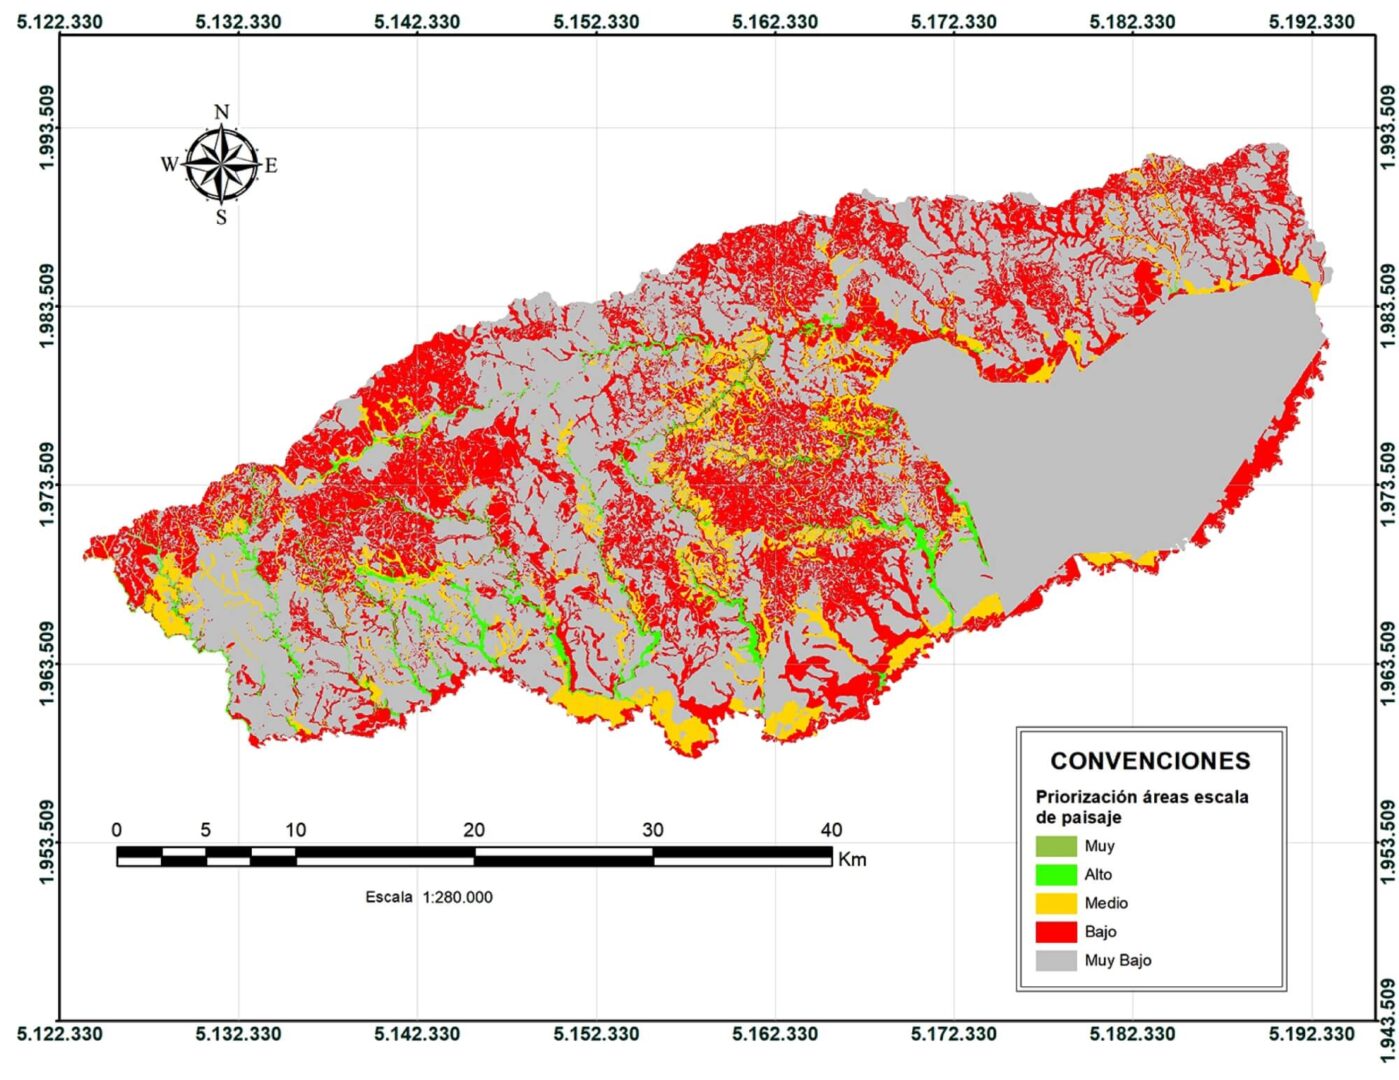
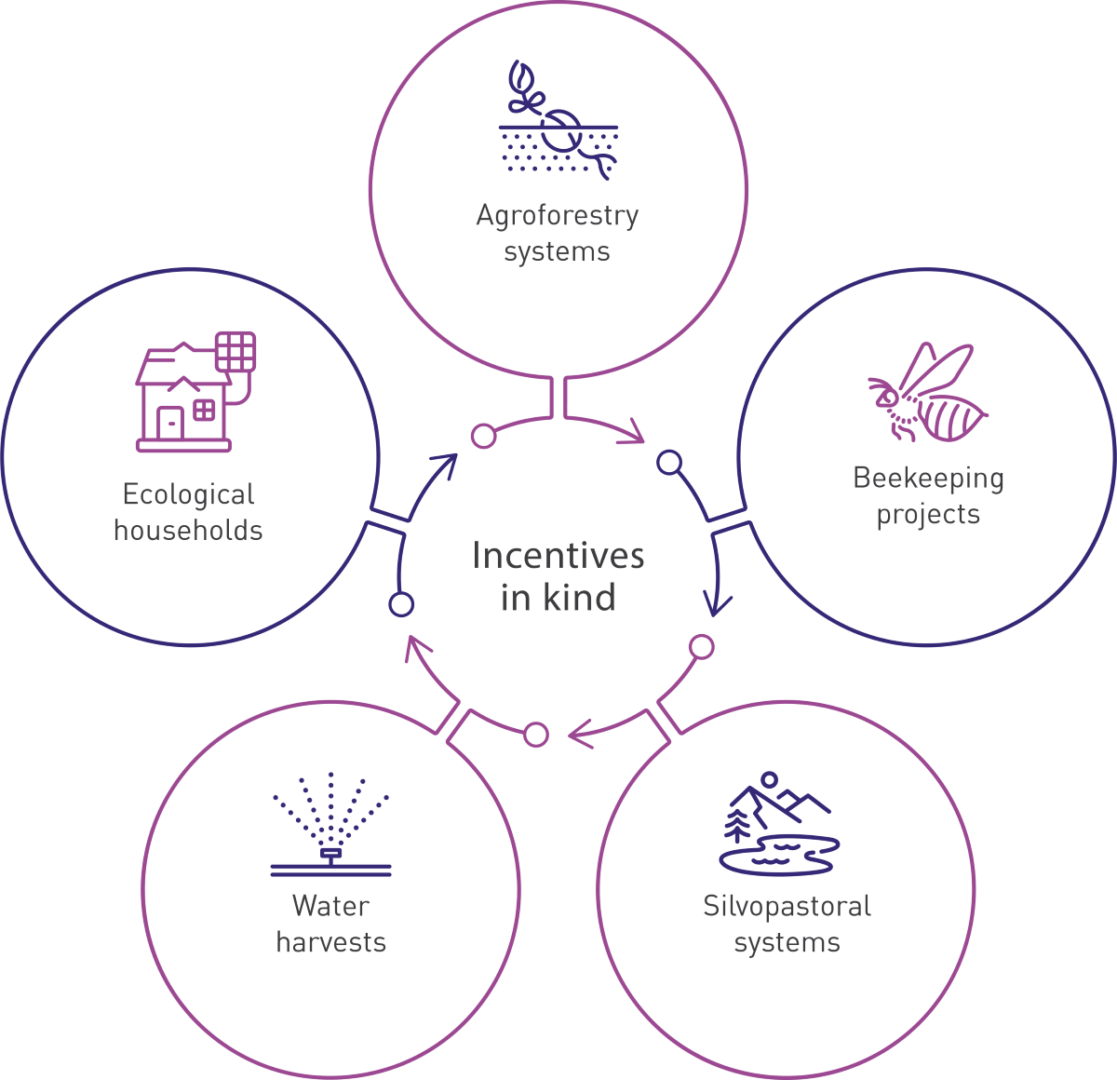
Ecopetrol S.A. elaborates investment and compensation plans for the conservation of biodiversity and its ecosystem services, in joint efforts with local communities in pre-established biodiversity clusters (Graph 28). These plans are implemented by signing voluntary conservation agreements, with incentives in kind, (Graph 29) to implement actions for the preservation, restoration, and/or sustainable use of biodiversity, in order to reduce conflicts between conservation and human activities.
Biodiversity clusters Eastern Andean Region
Graph 28. Biodiversity clusters for the implementation of environmental compensation obligations and compulsory investments of not less than 1%, in the case of the Eastern Andean Regional Environmental Department. Top: Tillavá cluster; bottom: cluster landscapes.

Incentives in kind from voluntary conservation agreements
As of December 31, there
1,430 obligations reported
in Ecopetrol S.A.’s information system, of which 377 correspond to compulsory investment obligations of no less than 1% and 369 to compensation obligations required for forest exploitation permits by the regional environmental authorities.
(419-1) (307-1)
To learn about the fines and penalties incurred in the period for non-compliance with environmental or socioeconomic regulations, go to the GRI Index.
Roadmap
Climate Change
Exceptional
Material Element
Sustainable Development Goals

| Impacted stakeholder groups | Areas that manage the impacts | Ecopetrol segments that generate the greatest impact |
|---|---|---|
| Suppliers | VCU | Upstream |
| Associates and Partners | VAB | Mid-stream |
| Clients | HSE | Downstream |
| Employees | VDP | Commercial |
| Investors | VRP | |
| State | ||
| Society and Community |
Why is the element material?
The reality of climate change has led Ecopetrol to recognize Growing with the Energy Transition and Generating Value with TESG as pillars of the corporate strategy.
The effects of Climate Change have a direct and significant impact on the Company’s operations, infrastructure, and sustainability, and on all stakeholder groups. In accordance with the above, and as a result of the analysis conducted by Ecopetrol, this element was classified as exceptional.
How is the material
element managed?
Ecopetrol defined the “Climate Action” pillar (link) as part of the environmental strategy, which seeks to maintain low carbon emission operations, reduce the vulnerability of the infrastructure and operations to climate variability and change, as well as adequately manage risks and identify opportunities associated with climate change. This pillar includes four (4) subject areas:
1
Mitigation
2
Adaptation and vulnerability
3
Research, development, and innovation
4
Participation in the drafting of public policy documents
How is the material
element evaluated?
Short, medium, and long
term goals and projects
Short term (2022-2023
- Keep the GHG inventory updated and verified for Scopes 1, 2, and 3.
- Define the goal for reducing methane emissions and Scope 3 emissions
- by 2030
- Implement reduction projects (fugitive emissions and venting, flaring, renewable energy, and energy efficiency) and reduce 262,761 tCO2e
- in 2022
- Produce 400 MW of renewable energy for self-consumption in 2023
- Increase energy efficiency by 3% in 2023
- Prioritize and develop Natural Climate Solution (SNC, by its Spanish acronym) projects
Medium term (2024-2025)
- Verify the GHG inventory in 2025
- Reduce 1,600,000 tCO2e in the 2020-2024 period*.
- Research emerging technologies and conduct hydrogen and CCUS pilots
- Reduce Scope 3 emissions
- Progress in the SNC portfolio to meet 2030 compensation goals
Long term (>2025)
- Zero net emissions by 2050 and 25% reduction by 2030 (Scopes 1 and 2)
- 50% reduction of Scope 1, 2, and 3 emissions by 2050
- Zero Routine Flaring by 2030
- Increase energy efficiency by 6% between 2023-2028
- Gradual incorporation of projects associated with emerging technologies such as hydrogen and CCUS
- Capture two MtCO2e through CNS in 2030
Management Efforts
The following progress was achieved in 2021 towards meeting the goals outlined in the Roadmap:
(305-1) (305-2) (305-3) (WEF 7)
The 2017-2020 Emissions Inventory was verified by Ruby Canyon Engineering.
In 2021, the base year of the GHG inventory was updated to 2019. Ecopetrol’s GHG emissions inventory is prepared under the ISO 14064-1 methodology, and specifically, following the guidelines of the GHG Protocol Corporate Standard (Scope 1), the GHG Protocol Scope 2 Guidance (Scope 2), the Corporate Value Chain (Scope 3), and the Accounting and Reporting Standard (Scope 3).
The main methodologies used to estimate atmospheric emissions for Ecopetrol’s Scope 1 are mass balance and emission factors, although in some specific cases, engineering calculations or computer models are used. For Scopes 2 and 3, emission factors are used.
The information associated with GHG emissions, and their estimation is managed using the SAP-Environmental Compliance – SAPEC software solution.
The global warming potentials used in the inventory are the ones reported in the Fifth Assessment Report of the Intergovernmental Panel on Climate Change (IPCC-AR5).
The sources most often used in the inventory to obtain emission factors are the following:
- Compendium of Greenhouse Gas Emissions Estimation Methodologies for the Oil and Gas Industry
- FECOC
- UPME
- AP-42
- ARPEL
- CORINAIR
- Guideline for fugitive emission calculations, June 2003
Table 38.
Direct and indirect Scope 1, 2, and 3 GHG emissions
/table]
(305-1) (305-2) (305-3) (WEF 7)
| Emissions | Unit of measurement | 2018 | 2019 | 2020 | 2021 |
|---|---|---|---|---|---|
| Gross value of | |||||
| direct GHG emissions (Scope 1) | tCO2e | 11,193,834 | 11,141,393 | 10,238,780 | 10,296,909 |
| Gross value of indirect GHG emissions when generating energy (Scope 2) | tCO2e | 427,546 | 602,040 | 776,125 | 680,399 |
| Gross value of other indirect GHG emissions (Scope 3) | tCO2e | NA | 120,784,646 | 116,698,200 | 112,629,936 |
NOTE 1: i) Data adjusted based on SIGEA 2018, 2019, and 2020 updates, ii) The 2021 data corresponds to information inventoried for the first 10 months of 2021 and averaged for the months of November and December. These data will change once the final information is available.
NOTE 2: The gases included in the table are the following CO2, CH4 y N20.
NOTE 3: The first estimate of Scope 3 emissions made by the Company was for 2019.
With respect to the data presented in Table 38, it is important to note that Ecopetrol’s atmospheric emissions inventory is structured under the operational control approach, for upstream, midstream, and downstream activities. For the 2021 term, Cenit, a mid-stream subsidiary, left Ecopetrol’s operational control, which is why the historical series corresponding to the 2018-2020 is recalculated for this report.
In relation to the facility operation of Ecopetrol’s subsidiary, Oleoducto de Colombia (ODC), operational control was exerted by the Company until January 2021, at which time it was handed over to its subsidiary, Cenit. Consequently, the Ecopetrol inventory for the 2021 term includes the GHG emissions generated at the facilities of this subsidiary during this month.
Additionally, in 2020, Ecopetrol took over the operation of the upstream Pauto – Floreña asset, which is why the emissions of this asset are included in 2021 and the 2018-2020 historical series is recalculated.
In 2022, the GHG emissions of the subsidiaries operating in Colombia will continue being incorporated, which will imply reviewing the current reporting scope of the inventory.
Biogenic emissions
(305-1) (305-2) (305-3) (WEF 7)
| Emissions | Unit of measurement | 2018 | 2019 | 2020 | 2021 |
|---|---|---|---|---|---|
| Biogenic CO2 emissions Scope 1 | tCO2e | 981.59 | 265.68 | 331.28 | 478.09 |
| Biogenic CO2 emissions Scope 2 | tCO2e | ||||
| Biogenic CO2 emissions Scope 3 | tCO2e | 379,590 | 331,731 | 280,169 |
NOTE: i) Data adjusted based on SIGEA 2018, 2019, and 2020 updates, ii) The 2021 data correspond to information inventoried for the first 10 months of 2021 and averaged for the months of November and December. These data will change once the final information is available.
GHG emissions intensity
Upstream intensity is estimated using upstream emissions on the numerator, and the production of crude oil, gas, white products in BOE on the denominator, under the organizational limit of operational control.
The downstream intensity is estimated using Scope 1 and 2 refining and petrochemical emissions on the numerator, and the annual loads to the Barrancabermeja and Cartagena refineries in the BOE on the denominator.
The gases included in the following table are CO2, CH4, and N2O.
GHG emissions intensity
| Process | Unit of measurement | 2018 | 2019 | 2020 | 2021 |
|---|---|---|---|---|---|
| Production | KgCO2e/BOE | 25.7 | 26.7 | 28.8 | 29.6 |
| Refining and petrochemicals | KgCO2e/BOE | 44.2 | 42.8 | 42.4 | 39.9 |
NOTE: i) Data adjusted based on SIGEA 2018, 2019, and 2020 updates, ii) The 2021 data correspond to information inventoried for the first 10 months of 2021 and averaged for the months of November and December. These data will change once the final information is available.
The reduced carbon intensity of the refining segment between 2020 and 2021 is mainly due to the implementation of energy efficiency actions at the refineries and reduced venting emissions at the Cartagena Refinery.
The increase in carbon intensity in the production segment is mainly due to the reversal of assets with a higher level of carbon intensity, previously operated by a third party (Pauto and Floreña), and higher energy consumption associated with the types of crude oil that are part of the company’s portfolio.
Reduction of
GHG emissions
293,594 tCO2e
were reduced in 2021 thanks to the implementation of new projects, far exceeding established goal of 235,262 tCO2e
by 25%
The emission reduction projects implemented are quantified using mass balance and emission factors.
The emission factors of the instruments below were used for calculation:
- Compendium of Greenhouse Gas Emissions Estimation Methodologies for the Oil and Gas Industry
- FECOC
- UPME
- AP-42
Projects implemented to reduce or avoid emissions
| Description of the initiative | Gases included in the calculation | Scopes that led to reductions | Standards or methodologies used for calculation | Development stage |
|---|---|---|---|---|
| Energy efficiency: Includes projects associated with changes in the energy matrix for another of less impact and process optimization. 42 projects were executed in the 2018- 2021 period (1 in 2018, 3 in 2019, 14 in 2020, and 24 in 2021). | CO2 CH4 N2O | Scope 1 | Estimated reductions using mass balance and/or emission factors in Ecopetrol’s own calculation model. | Implemented |
| Fugitive emissions and vents: includes projects associated with the elimination of leaks and vents in the processes. 15 projects were executed in the 2018-2021 period (1 in 2018, 6 in 2020, and 8 in2021). | CH4 | Scope 1 | Estimated reductions using mass balance and/or emission factors in Ecopetrol’s own calculation model. | Implemented |
| Optimization of flaring: includes projects associated with the optimization of flaring through the sale, self- generation, or optimization of the process. 19 projects were executed in the 2018- 2021 period (2 in 2018, 2 in 2019, 6 in 2020, and 9 in 2021). | CO2 CH4 | Scope 1 | Estimated reductions using mass balance and/or emission factors in Ecopetrol’s own calculation model. | Implemented |
| Renewable energy: includes projects associated with energy generation via renewable sources. Three projects were implemented in the 2018-2021 period (1 in 2019 and 2 in 2021). | CO2 | Scope 2 | Estimated reductions using mass balance and/or emission factors in Ecopetrol’s own calculation model. | Implemented |
[/src]
Tons of GHG emissions reduced or avoided as a direct consequence of reduction initiatives in each of the projects
| Emissions | Unit of measurement | 2018 | 2019 | 2020 | 2021 |
|---|---|---|---|---|---|
| Energy efficiency | tCO2e | 35,990 | 161,473 | 128,596 | 186,713 |
| Fugitive emissions and vents | tCO2e | 33,894 | 0 | 23,257 | 59,817 |
| Optimization of flaring | tCO2e | 35,386 | 210,370 | 47,994 | 45,135 |
| Renewable energies | tCO2e | 0 | 8,760 | 0 | 1,929 |
NOTE: i) Data adjusted based on SIGEA 2018, 2019, and 2020 updates,
ii) The 2021 data correspond to information inventoried for the first 10 months of 2021 and averaged for the months of November and December. These data may change once the final information is available.
Progress was made in 2021 in the detection and measurement of methane emissions, which reached
95%
at the production facilities of Ecopetrol operated assets, using a bottom-up approach (based on representative samples using infrared cameras and others).
By adopting a top-down approach (measurement at a regional scale using satellite images or overflights), Ecopetrol covered 95% of the production facilities, the Barrancabermeja and Cartagena refineries, the Unconventional Reservoirs (YNC) pilot project, and the assets with partners in Middle Magdalena using an aircraft with specific methane sensors and
covering a total of
1,205 Km2.
Management strategy
for fugitive emissions,
venting, and burning
Ecopetrol has a fugitive emissions and venting management strategy, which seeks the following:
- Achieve compliance with the sectoral goal of reducing methane emissions from member companies of the Climate and Clean Air Coalition (CCAC) by 2025 in absolute terms of
45%
between
60% and 75%
by 2030, exceeding the levels estimated for 2015. In 2022, Ecopetrol will establish its own methane emission reduction goal.
- Report a maximum of
100% of operated assets in 2024 and
100% of non-operated
assets in 2026, at the
4/5 measurement level
in accordance with the commitments established for OGMP 2.0 members. (Oil and Gas Methane Partnership).
To this end, progress is being made in the development and implementation of the following lines of action:
(i)
Updating and adjusting the methane emissions inventory, construction of own emission factors, and definition of reduction goals.
(ii)
Incorporation of design criteria and good engineering practices to reduce fugitive emissions and venting.
(iii)
Implementation of the LDAR – Leak Detection and Repair, a program for the identification, quantification, and repair of methane emission leaks.
With respect to the reduction of flaring, Ecopetrol aims to eliminate its routine burning by 2030, in line with the World Bank’s “Zero Routine Flaring by 2030” initiative, in order to reduce routine burning in existing fields and avoid routine burning in new oil reservoirs.
A new campaign to detect methane emissions was deployed in 2021, with greater coverage than the campaign conducted between 2019 and 2020, identifying
1,085 leaks
that already have an action plan, and of which,
184 (17%)
have already been closed
Public Policy efforts
related to climate change
Ecopetrol articulates its climate change strategy with the National Government’s public policy and contributes to the construction of technical and regulatory guidelines to strengthen the country’s institutional capacity in the area of climate change.
In 2021, Ecopetrol participated in working groups to draft the following documents, regulations, and strategies associated with climate change:
(i)
Colombia’s Long-Term Climate Strategy E2050,
(ii)
Update to the Comprehensive Climate Change Management Plan for the Mines and Energy sector,
(iii)
The Climate Action Law,
(iv)
Conpes “Public policy to reduce disaster risk conditions and adapt to climate variability phenomena”,
(v)
The Energy Transition Law and the promotion of Non-conventional sources of energy,
(vi)
Colombia’s The Hydrogen Roadmap, and
(vii)
The proposed resolution for the regulation of fugitive emissions, vents, and flaring.
Furthermore, the Company joined the Carbon Neutrality Program led by the Ministry of Environment and Sustainable Development of Colombia and signed a Voluntary Agreement with the MME to promote carbon neutrality and climate resilience in the hydrocarbon sector.
In terms of global initiatives, the Company is part of the Climate and Clean Air Coalition (CCAC) led by the United Nations, the International Petroleum Industry Environmental Conservation Association (IPIECA), and Zero Routine Flaring by 2030 led by the World Bank.
Roadmap
Integrated Water Management
Exceptional
material element
Sustainable Development Goals

| Impacted stakeholder groups | Areas responsible for managing the impacts | Ecopetrol segments with the greatest impact |
|---|---|---|
| Society and Community | VDS | Upstream |
| Investors and Shareholders | VSHE | Downstream |
| Local State | VDP | |
| Employees | VRP | |
| National State | ||
| Clients | ||
| Suppliers |
Why is the element material?
Integrated Water Management is an Exceptional element of the Generating Value with TESG pillar of the Corporate Strategy. This is due to its significant impact on value generation in the short, medium, and long term, and its relevance for stakeholders.
Responsible management of water resources is essential for the operational continuity of the different business areas, as well as to ensure the protection and conservation of the ecosystem service and its availability for communities and society.
¿How is the material
element managed?
The Integrated Water Management Roadmap was defined in 2021, targeting water neutrality by 2045 on the path toward positive net water. This means replacing 100% of the water consumed by the operations, thereby generating a positive impact in the basins used as catchments or discharges. To achieve this goal, Ecopetrol focuses on the following:
Improving operational efficiency in water management (leveraging on the implementation of technology and the generation of knowledge), reducing freshwater catchments and discharges by maximizing internal reutilization and the use of alternative water sources (e.g., municipal wastewater, seawater, brackish water from deep aquifers, etc.), and the reutilization of produced water in other sectors (e.g., agriculture).
Protection of water basins by implementing own and collective actions that compensate the remaining volume of water consumed by the operations.
How is the material
element evaluated?
Integrated water management is evaluated using the three (3) indicators below, which are monitored on a monthly basis.
Reduction of the volume of fresh water withdrawn for industrial use
Percentage of reutilization of collected water and produced water to leverage the reduction of catchments and discharges
Volume of water reused in other sectors (e.g., agriculture).
In 2021, the water reutilization indicator was incorporated into Ecopetrol S.A.’s TBG, which is part of the variable remuneration, and this goal was exceeded as a result.
These goals are updated annually under the principle of continuous improvement, and they are monitored based on information uploaded by the Group’s businesses in the SIGAR-Aguas tool. The results of the indicators are presented monthly to the HSE and management committees of the Vice Presidency of Production and the Vice Presidency of Refining and Petrochemicals.
In 2021, the water reutilization indicator was incorporated into the Ecopetrol Group’s TBG, which is part of the variable remuneration.
Short-term goals are updated annually.

Short, medium,
and long-term
goals and projects
The Integrated Water Management Roadmap towards Water Neutrality sets goals to optimize water use, maximize reutilization, increase reutilization, and reduce water catchments and discharges.
All the goals presented below were established with respect to 2019 (base year) and are outlined for compliance with the objective of water neutrality:
- Reduce 14% of freshwater catchment
- Increase the reutilization of produced water to 28.8%
- Maintain industrial water reutilization at 41.2%
Medium term (2030)
- Reduce 58% of freshwater catchment for industrial use
- Reduce 66% of industrial discharges to surface water bodies
Medium term (2030)
- Reduce 66% of freshwater catchment for industrial use
- Reduce 100% of industrial discharges to surface water bodies
2021 Management Efforts26
The main achievements of the efforts towards water neutrality with respect to the base year (2019) were:
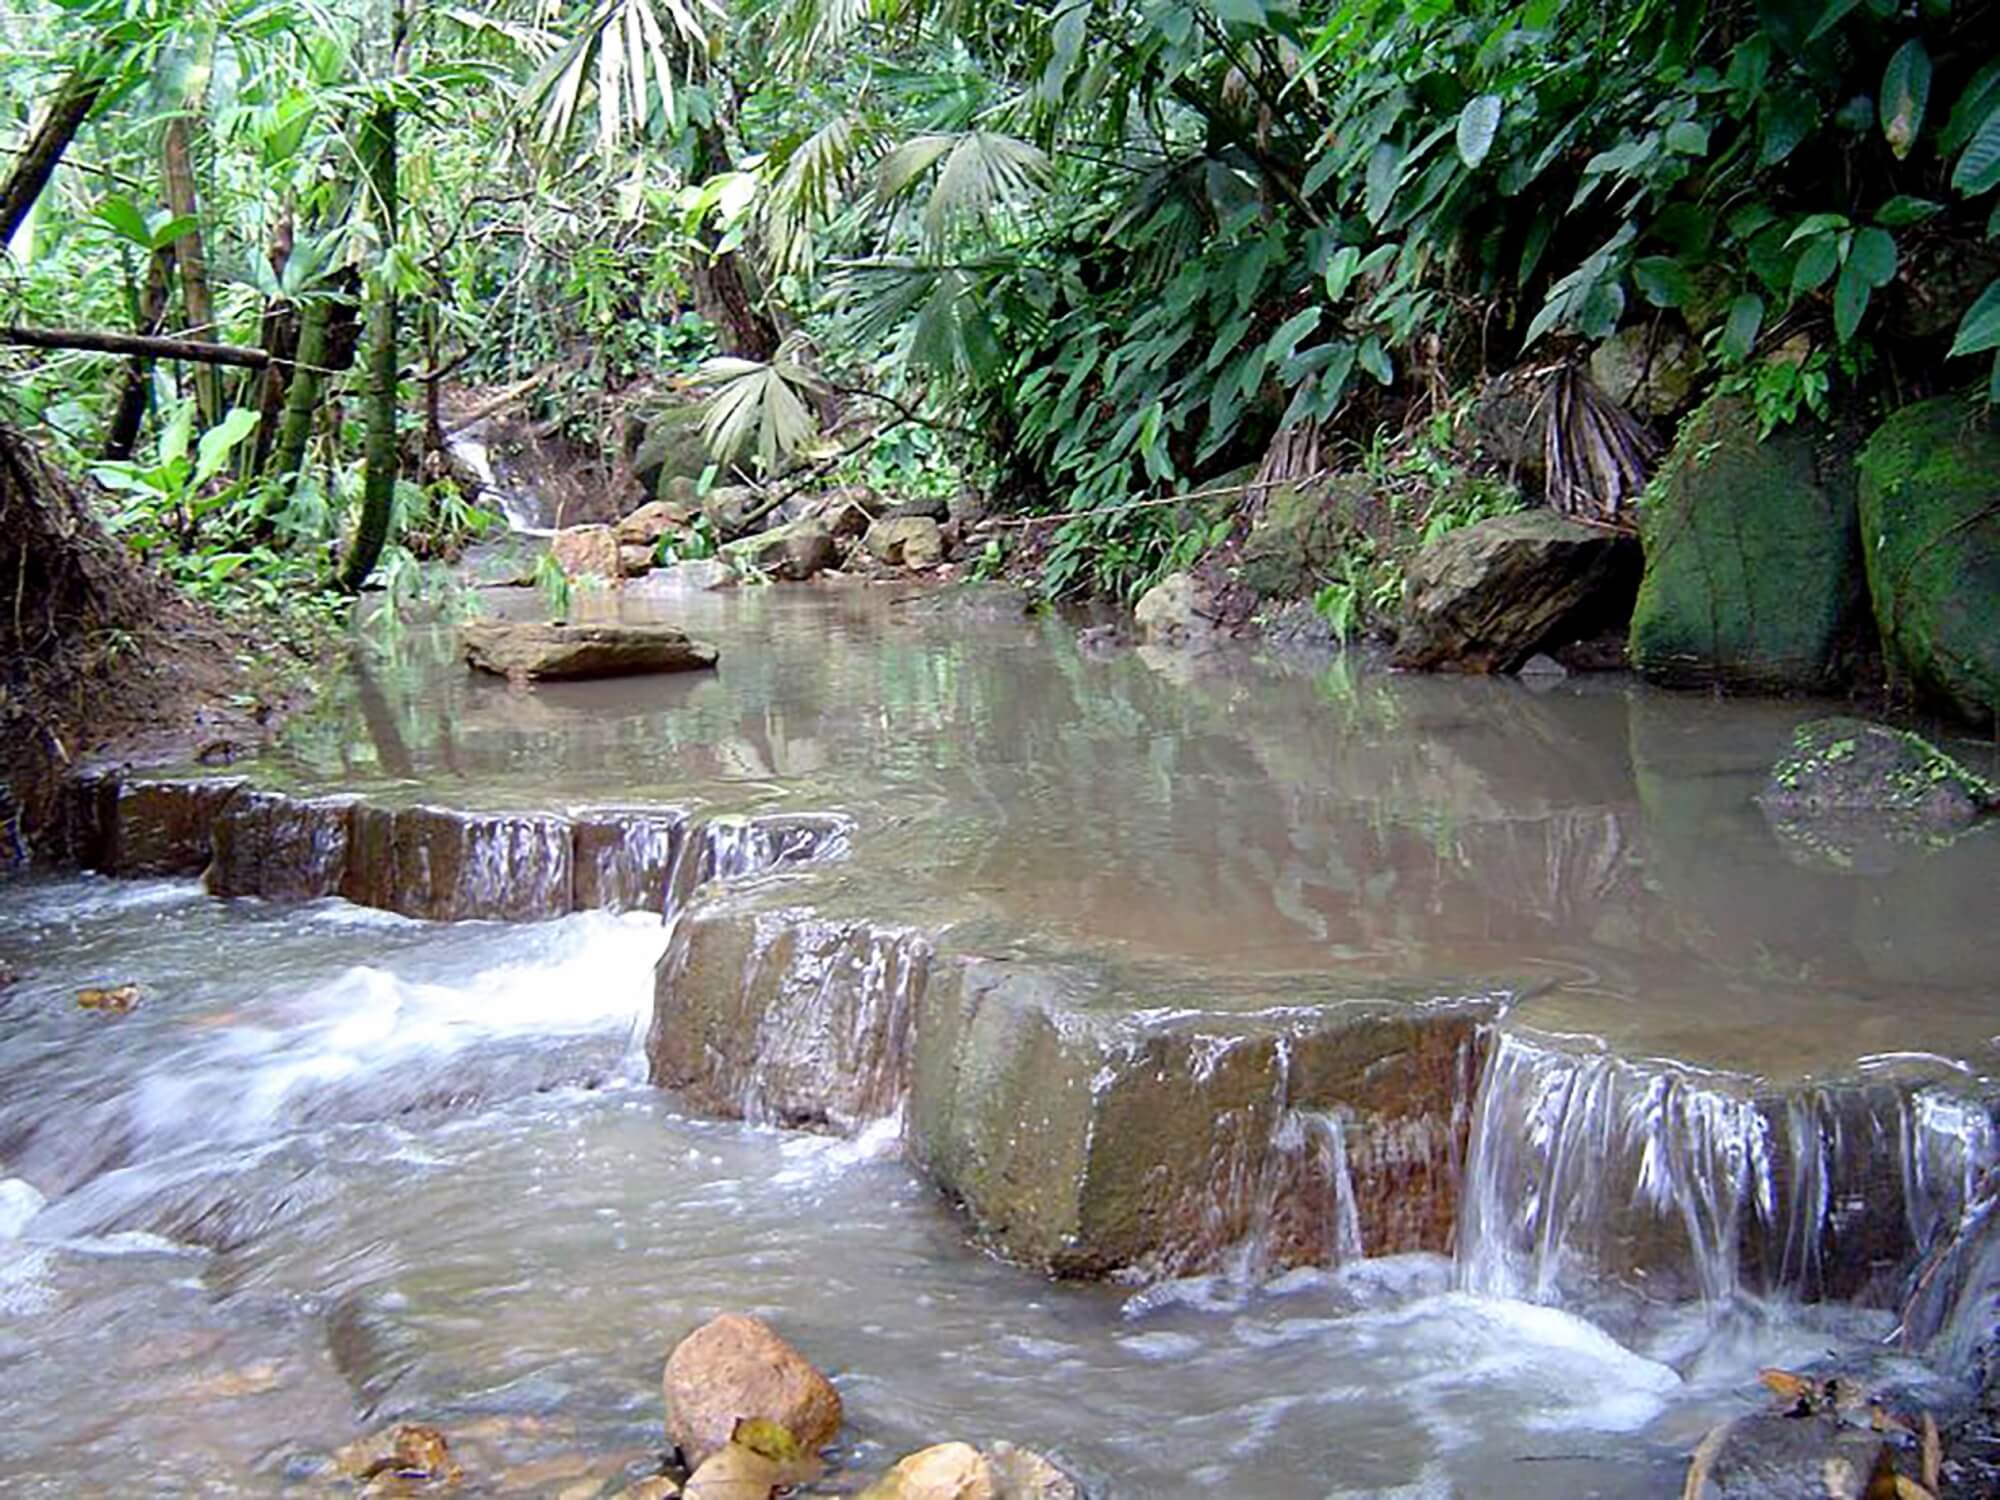
Interaction with water
as a shared resource
(103-1) (WEF 11E)
Superficial (61% of total water catchment): 29% reduction compared to 2020 due to lower water catchment requirements for recovery in the La Cira Infantas (-1.2 million m3) and Yaguará (-31 thousand m3) fields. It is important to note that the volume of drinking water delivered to the community of El Centro (approximately 8.8 million m3) is not included as of 2021.
Underground (21% of total water catchment): 6% reduction compared to 2020, mainly due to lower water requirements for recovery in Tibú (-941 thousand m3 due to public order conditions) and Yariguí-Cantagallo (-331 thousand m3 due to optimizations in the recovery process).
Aqueducts and external suppliers (18% of total water catchment): 4% reduction compared to 2020 due to lower catchments at the Cartagena Refinery.
Marine waters (0.0%): 0.01 million m3 of marine waters to test fire-fighting systems.
The water collected is mainly used for refining processes (71.0%), followed by Production (28.8%), and the remaining 0.2% was used in administrative areas.
Impact identification and
management due to catchments
(103-1) (WEF 11E)
Water consumption by Ecopetrol assets ranges between
0 and 2.5%
of the water supply of the basins where catchment takes place, which is why the potential impact of the activities is not significant.
That said, the impacts that Ecopetrol can generate on water are related to water consumption, which, under natural circumstances of scarcity due to climatic variability and seasonal rainfall, could generate changes in water availability for users in the catchment points downstream. To reduce this potential impact, Ecopetrol, during the environmental planning phase of each project or initiative, and in accordance with the methodology established by the ANLA, identifies the availability dynamics of water resources in the area of influence, and defines catchment limits and management and monitoring measures to be incorporated in the environmental management plans subject to evaluation and approval by the Environmental Authority.
Ecopetrol files a licensing and permitting process with the environmental authorities before using or exploiting the water resources. The licenses and permits granted set the conditions so that catchments and discharges do not generate significant impacts on the availability and quality of water bodies. Once the authorizations have been granted, legal compliance therewith is supervised, and the supply and quality conditions of the water bodies are continuously monitored. The monitoring results are recorded in the SIGAR – Aguas tool to identify potential deviations and generate the corresponding corrective action plans.
At the operational and corporate level, operational efficiency strategies are planned and implemented in water management in order to reduce the Company’s freshwater catchment and discharge volumes, accompanied by a technological component and the protection of natural capital in the basins.
Lastly, Ecopetrol uses the water footprint calculation methodology (ISO 14046:2014) to assess the following:
The consumption footprint
Extracted fresh water that evaporates, is incorporated into the product, or that is not returned to the basin
The water scarcity footprint
Impact of water consumption with respect to available fresh water
The degradation footprint
Deterioration of freshwater quality due to the presence of polluting substances

Sustainability
and Water Security
For Ecopetrol, it is essential to support and be associated with water security efforts at the international and national levels, which is why it participates in the CEO Water Mandate and Water Coalition for Colombia initiatives. Currently, the water security initiatives promoted by Ecopetrol are part of the Water Action Hub, the global collaboration and knowledge exchange platform for water sustainability and climate resilience.
At the regional level, and as part of the formulation of a Water Governance Mechanism for the supply basins in the municipalities of Acacías and Villavicencio, the Promoter Group was created in 2021, together with The Nature Conservancy (TNC), with the participation of
16 public and private entities
interested in collective action, to solve the water security challenges of said basins in the department of the Meta. This initiative contributes to the purpose of offsetting the remaining consumption footprint to achieve the goal of water neutrality.
In partnership with IDEAM, Ecopetrol updates and monitors the status of surface water resources and generating hydrometeorological alerts in the VMM. Moreover, to improve knowledge of the basins in the area of influence associated with Ecopetrol operations, a water security situational analysis was conducted in the hydrographic subzones of the Opón and Sogamoso rivers and the middle and lower basins of the Lebrija river in the department of Santander.
Lastly, Ecopetrol continues deploying actions for the conservation of natural capital and biodiversity, through voluntary efforts and by complying with the obligations of environmental compensation and
1%,
investment, which contribute to the conservation and monitoring of water resources.
Management of impacts
related to water discharges
(103-2) (WEF 11E)
With respect to discharges, a total of 61.6 million m³ were recorded,
41% less than in 2020,
mainly due to
(i)
The closure of 90,000 barrels of water to the Magdalena River and
(ii)
the interruption of the Castilla field discharge in the first half of the year.
94.4% of the total was discharged into surface water bodies, 4.1% into the sea, 1.2% into the ground, and 0.2% into external managers and sewers. Exploration and production activities generated
76.7% of total discharges
(mainly production), Refining 23.2%, and corporate areas 0.1%.
Identification and management
of impacts due to discharges
(303-1) (WEF 11E)
The discharges could change the quality of the water bodies. In this case, environmental evaluations are conducted from the planning stage, based on the load and the assimilation and dilution capacity of the receiving body to confirm that no significant impacts are generated on them. Ecopetrol treats
100% of its wastewater
before being discharged and ensures compliance with the maximum permissible values established in national and local environmental regulations. In addition, the Company monitors the receiving bodies to confirm that they are not affected by their discharges.
Discharge quality criteria are established by competent environmental authorities, who determine the maximum permissible values for discharges to surface water bodies and sewers, seawater, and soil, applicable to each productive sector of the industry. Specifically for the hydrocarbon sector, maximum values are defined depending on the activity within the value chain (Exploration, Production, Refining, and Transportation), and the Company monitors more than 40 quality-related parameters.
To define the quality criteria, in compliance with current regulations, Ecopetrol conducts environmental assessments of the discharges based on the assimilation and dilution capacity of the receiving bodies to minimize impacts on the resource.
Priority Substances
Ecopetrol uses the results of the water footprint evaluation (ISO 14046) to define the priority substances in discharge management. To this end, the following water degradation impact indicators are included in the assessment:
(i)
Human toxicity: based on the USEtox model, it assesses the danger of wastewater discharges in terms of carcinogenic and non-carcinogenic toxicity for humans (CTUh).
(ii)
Ecotoxicity in fresh water: based on the USEtox model, it evaluates various toxicological mechanisms caused by the release of substances with a direct effect on the health of the ecosystem in (CTUe).
(iii)
Ecotoxicity of seawater: based on the Recipe model.
(iv)
Fresh water acidification: based on the Accumulated Excess EA model, it evaluates the impact on fresh water due to the release of NOx, SOx, and NH3 into the atmosphere, which could cause acid rain. In addition, environmental regulations define the most relevant parameters for each productive sector and establish the corresponding maximum allowable limits.

Water extraction by area
(303-3) (WEF 10)
| Water extraction by area | Unit of measurement | 2018 | 2019 | 2020 | 2021 |
|---|---|---|---|---|---|
| Total extraction all areas | Thousands of m3 | 440,089 | 453,769 | 454,658 | 428,243 |
| Total surface water | Thousands of m3 | 38,569 | 38,369 | 34,465 | 24,326 |
| Surface: Fresh water (total dissolved solids ≤1000mg/l) | Thousands of m3 | 38,569 | 38,369 | 34,465 | 24,326 |
| Surface: Other waters (total dissolved solids >1000mg/l) | Thousands of m3 | – | – | – | – |
| Total groundwater | Thousands of m3 | 10,800 | 8,459 | 9,347 | 8,771 |
| Underground: Fresh water (total dissolved solids ≤1000mg/l) | Thousands of m3 | 10,800 | 8,459 | 9,347 | 8,771 |
| Underground: Other waters (total dissolved solids >1000mg/l) | Thousands of m3 | – | – | – | – |
| Total sea water | Thousands of m3 | – | – | – | 10 |
| Sea: Fresh water (total dissolved solids ≤1000mg/l) | Thousands of m3 | – | – | – | – |
| Sea: Other waters (total dissolved solids >1000mg/l) | Thousands of m3 | – | – | – | 10 |
| Total aqueducts | Thousands of m3 | 8,154 | 7,800 | 7,301 | 6,983 |
| Aqueducts: Fresh water (total dissolved solids ≤1000mg/l) | Thousands of m3 | 8,154 | 7,800 | 7,301 | 6,983 |
| Aqueducts: Other waters (total dissolved solids >1000mg/l) | Thousands of m3 | – | – | – | – |
| Total produced water | Thousands of m3 | 382,567 | 399,141 | 403,544 | 388,152 |
| Total produced water: Fresh water (total dissolved solids ≤1000mg/l) | Thousands of m3 | 84,574 | 91,618 | 100,150 | 302,003 |
| Total produced water: Other waters (total dissolved solids >1000mg/l) | Thousands of m3 | 297,993 | 307,523 | 303,394 | 86,149 |
Note: There is a significant difference between “fresh water” and “other waters in the produced water category, given that in 2021, the monitors of the Rubiales field (approximately 220 million m3) showed TDS values less than 1,000 ppm (fresh water), while in 2020, they had been above 1,000 ppm (other waters).
Water extraction by water stressed areas
| Water extraction by water stressed area | Unit of measurement | 2018 | 2019 | 2020 | 2021 |
|---|---|---|---|---|---|
| Total extraction water stressed areas | Thousands of m3 | 25,877 | 25,202 | 23,456 | 24,647 |
| Total surface water | Thousands of m3 | 4,598 | 4,067 | 3,231 | 4,005 |
| Surface: Fresh water (total dissolved solids ≤1000mg/l) | Thousands of m3 | 4,598 | 4,067 | 3,231 | 4,005 |
| Surface: Other waters (total dissolved solids >1000mg/l) | Thousands of m3 | – | – | – | – |
| Total groundwater | Thousands of m3 | 313 | 248 | 69 | 84 |
| Underground: Fresh water (total dissolved solids ≤1000mg/l) | Thousands of m3 | 313 | 248 | 69 | 84 |
| Underground: Other waters (total dissolved solids >1000mg/l) | Thousands of m3 | – | – | – | – |
| Total sea water | Thousands of m3 | – | – | – | 10 |
| Sea: Fresh water (total dissolved solids ≤1000mg/l) | Thousands of m3 | – | – | – | – |
| Sea: Other waters (total dissolved solids >1000mg/l) | Thousands of m3 | – | – | – | 10 |
| Total aqueducts | Thousands m3 | 8,078 | 7,740 | 7,220 | 6,970 |
| Aqueducts: Fresh water (total dissolved solids ≤1000mg/l) | Thousands of m3 | 8,078 | 7,740 | 7,220 | 6,970 |
| Aqueducts: Other waters (total dissolved solids >1000mg/l) | Thousands of m3 | – | – | – | – |
| Total produced water | Thousands of m3 | 12,887 | 13,146 | 12,935 | 13,578 |
| Total produced water: Fresh water (total dissolved solids ≤1000mg/l) | Thousands of m3 | – | – | – | – |
| Total produced water: Other waters (total dissolved solids >1000mg/l) | Thousands of m3 | 12,887 | 13,146 | 12,935 | 13,578 |
Notes
- There is evidence of a 20% increase compared to 2020 in the extraction of surface fresh water in water stressed areas (water use index greater than 40%), mainly due to increased catchment by the Barrancabermeja Refinery in the San Silvestre swamp (+822 thousand m3).
- With regard to groundwater, there was a 21% increase due to higher catchments for industrial use in the Dina Cretáceos, Lisama, and San Francisco fields.
- Total water extraction in water stressed areas is equivalent to 6% of Ecopetrol’s total extraction.
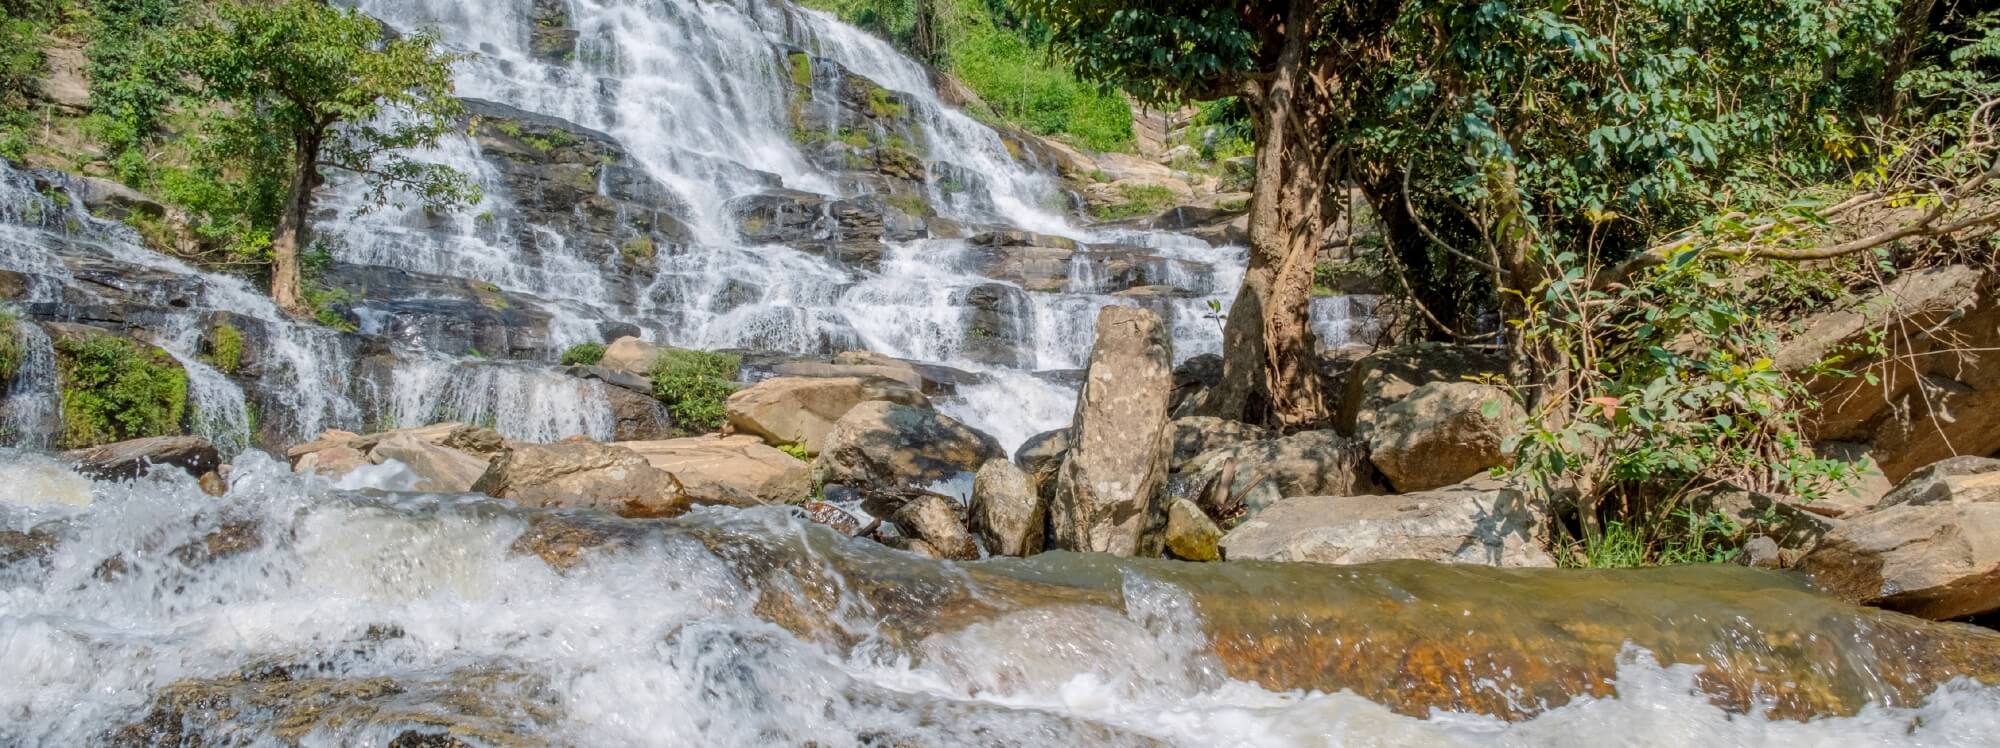
Amount of water reused by Ecopetrol in 2021
(OG-5) (WEF 10)
| Water reutilization | Unit of measurement | 2018 | 2019 | 2020 | 2021 |
|---|---|---|---|---|---|
| Total water reutilization | Thousands of m3 | 85,015 | 89,396 | 96,524 | 111,262 |
| Water catchment reutilization | Thousands of m3 | 17,660 | 16,971 | 11,365 | 16,873 |
| Produced water reutilization | Thousands of m3 | 67,355 | 72,424 | 85,159 | 94,389 |
Note: There was a 15% increase in the total volume of reused water due to:
- Increased reutilization of water catchment at the Barrancabermeja Refinery (+4.9 million m3) after identifying reutilization currents that had not been reported, as well as increased reutilization at the Cartagena Refinery (+683 thousand m3)
- Increased reutilization of produced water due to better performance in injection for recovery, Castilla +5.4 million m3, Apiay and Suria +343 thousand m3, Chichimene +2.7 million m3.
- A total of 94.4 million m3 of production water were reused, which means a percentage of reuse of 24% with respect to the total water produced, achieving 106% compliance with the goal established for 2021 (22.4 %).
- A total of 16.9 million m3 of effluents from the use of collected water were reused/recirculated, which represents a reuse of 42% with respect to the volume collected, achieving 133% compliance with the goal established for 2021 (34, two%).
Effluent management
| Effluent management | Unit of measurement | 2018 | 2019 | 2020 | 2021 |
|---|---|---|---|---|---|
| Reutilization | Thousands of m3 | 85,015 | 89,396 | 96,524 | 111,262 |
| Reutilization | Thousands of m3 | 52 | 1,159 | 3,134 | 2,305 |
| Disposal | Thousands of m3 | 243,975 | 249,339 | 245,429 | 246,940 |
| Discharges | Thousands of m3 | 100,011 | 96,686 | 87,278 | 61,555 |
| Total effluents | Thousands of m3 | 429,053 | 436,580 | 432,365 | 422,061 |
Amount of water discharge in all areas
| Water discharge in all areas | Unit of measurement | 2018 | 2019 | 2020 | 2021 |
|---|---|---|---|---|---|
| Surface water | Thousands of m3 | 97,050 | 93,035 | 83,942 | 58,199 |
| Sea water | Thousands of m3 | 2,061 | 2,671 | 2,360 | 2,508 |
| Soil water | Thousands of m3 | 816 | 850 | 849 | 751 |
| Sewage water | Thousands of m3 | 84 | 131 | 128 | 97 |
| Total discharges by fresh water (total dissolved solids ≤1000mg/l) | Thousands of m3 | 66,192 | 65,703 | 56,872 | 45,832 |
| Total discharges by other waters (total dissolved solids >1000mg/l) | Thousands of m3 | 33,819 | 30,983 | 30,407 | 15,723 |
[/src]
Note: There was a 29% reduction of total discharges by the Company, mainly due to the temporary suspension of the discharge from Castilla. With regard to the differentiation of discharges by their TDS content, there was a 19% reduction in the “freshwater line <1000 ppm TDS” due to the suspension of the discharge from Castilla (-23.5 million m3), and the inclusion in 2021 (according to legal monitoring) as fresh water from the discharges of Rubiales (+12.8 million m3).
Amount of water discharge by water stressed areas
| Water discharge in water stressed areas | Unit of measurement | 2018 | 2019 | 2020 | 2021 |
|---|---|---|---|---|---|
| Surface water | Thousands of m3 | 564 | 532 | 480 | 584 |
| Sea water | Thousands of m3 | 2,059 | 2,669 | 2,339 | 2,508 |
| Soil water | Thousands of m3 | 213 | 276 | 140 | 107 |
| Sewage water | Thousands of m3 | 34 | 61 | 19 | – |
| Total discharges by fresh water (total dissolved solids ≤1000mg/l) | Thousands of m3 | 335 | 464 | 257 | 180 |
| Total discharges by other waters (total dissolved solids >1000mg/l) | Thousands of m3 | 2,535 | 3,075 | 2,721 | 3,019 |
Note: The increased volume of discharges in water stressed areas is due to higher discharges in Llanito (+104 thousand m3) and the Cartagena Refinery (+170 thousand m3). The discharge from Llanito was definitively eliminated as of November 2021.
Amount of discharge by treatment level
| Discharge by treatment level | Unit of measurement | 2018 | 2019 | 2020 | 2021 |
|---|---|---|---|---|---|
| Without treatment | Thousands of m3 | – | – | – | – |
| Pretreatment | Thousands of m3 | – | – | – | – |
| Primary treatment | Thousands of m3 | 17,091 | 9,476 | 3,844 | 4,302 |
| Secondary treatment | Thousands of m3 | 82,835 | 87,081 | 83,319 | 57,197 |
| Tertiary treatment | Thousands of m3 | 3 | 2 | 0 | – |
| Other treatments | Thousands of m3 | 82 | 127 | 115 | 56 |
Note: In primary treatments, discharges with exclusively physical treatments are reported; secondary treatments involve biological treatments; tertiary treatments include advanced treatments like reverse osmosis. The volume reported under “Other treatments” corresponds to wastewater delivered to external managers, who are responsible for the final treatment and disposal. The decrease in water discharged with tertiary treatments is because these streams were 100% reused.

No events exceeding maximum permissible discharge parameters were recorded in 2021.
Ecopetrol’s 2021 water consumption in water stressed areas
| Water consumption | Unit of measurement | 2018 | 2019 | 2020 | 2021 |
|---|---|---|---|---|---|
| Inlets | Thousands of m3 | 25,877 | 25,202 | 23,456 | 24,647 |
| Fresh water catchments | Thousands of m3 | 12,989 | 12,055 | 10,520 | 11,069 |
| Produced water | Thousands of m3 | 12,887 | 13,146 | 12,935 | 13,578 |
| Effluents | Thousands of m3 | 15,490 | 16,558 | 15,486 | 16,179 |
| Water catchment injected for recovery | Thousands of m3 | 250 | 234 | 41 | 0.08 |
| Drinking water supplied to third parties (communities) | Thousands of m3 | 71 | 95 | 4 | – |
| Produced water reinjected for recovery | Thousands of m3 | 12,299 | 12,691 | 12,462 | – |
| Produced water reinjected for final disposal | Thousands of m3 | – | – | – | – |
| Reutilization of produced water for agricultural irrigation | Thousands of m3 | – | – | – | – |
| Discharges | Thousands of m3 | 2,870 | 3,539 | 2,978 | 3,199 |
| Balance (consumption) | Thousands of m3 | 10,387 | 8,643 | 7,970 | 8,469 |
Amount of water produced by produced water management method in 2021
(G-5) (WEF WEF 10)
| Produced water by disposal method | Unit of measurement | 2018 | 2019 | 2020 | 2021 |
|---|---|---|---|---|---|
| Total water produced | Thousands of m3 | 383,270 | 399,164 | 405,770 | 389,397 |
| Discharge | Thousands of m3 | 71,888 | 76,241 | 72,047 | 45,763 |
| Reinjected as final disposal | Thousands of m3 | 243,975 | 249,339 | 245,429 | 246,940 |
| Reinjected for recovery | Thousands of m3 | 67,146 | 71,685 | 84,845 | 94,259 |
| Reused | Thousands of m3 | 52 | 1,159 | 3,134 | 2,305 |
| Other reuses | Thousands of m3 | 209 | 739 | 314 | 130 |
Roadmap
Biodiversity
Outstanding
Material Element
Sustainable Development Goals



| Impacted stakeholder groups | Areas responsible for managing the impacts | Ecopetrol segments with the greatest impact |
|---|---|---|
| Suppliers, contractors, and their workers | VHSE | Upstream |
| Clients | Midstream | |
| Investors and Shareholders | Downstream | |
| National State | ||
| Local State | ||
| Society and Communities | ||
| Associates and Partners | ||
| Employees, Pensioners, and their Beneficiaries |
Why is the
element material?
Ecopetrol defined Biodiversity and Ecosystem Services as an outstanding element, considering the risks and opportunities it represents for the Company in a mega-diverse country. This is also in order to properly manage biodiversity and ecosystem services, meeting the expectations of stakeholders and retaining the license to operate.
Ecopetrol recognizes the need to identify and manage the dependencies and potential impacts on biodiversity and ecosystem services, as well as the importance of adopting actions for conservation, in line with the SDGs.
How is the material
element managed?
This material element is managed in compliance with four (4) subject areas that are part of the Generating Value with TESG pillar of the 2040 Strategy, which places particular emphasis on generating value in the energy transition and the decarbonization of operations.
The four (4) subject areas are:
Mitigation Hierarchy:
its purpose is to prevent, avoid, mitigate, and offset potential residual impacts.
Nature-based solutions:
the network of eco-reserves and natural climate solution and tree planting projects seek to respond to challenges associated with climate change, water resource management, biodiversity and ecosystem services, together with local communities.
Knowledge generation:
this includes the generation of information on biodiversity and ecosystem services to strengthen decision-making.
Culture of biodiversity:
this seeks to strengthen the value of biodiversity and ecosystems in the Company.
The Company’s aspirations and goals in terms of biodiversity are reflected in the Biodiversity Strategy, which is based on the following guiding principles:
Prevention
Caution
No net loss
Positive net impact
To implement the Biodiversity Strategy, Ecopetrol established partnerships with national and international environmental entities such as the Ministry of Environment and Sustainable Development of Colombia, the Alexander von Humboldt Institute, Wildlife Conservation Society (WCS), Fondo Acción, TNC, Fundación Natura, South Pole, and ISA (Conexión Jaguar).
How is the material
element evaluated?
Like all the material elements of the Company, Biodiversity and Ecosystem Services has its Roadmap with goals, management indicators, and milestones to be achieved in the short, medium, and long term. Depending on their relevance, some are included in the TBG.
In terms of mandatory investments, specific indicators are defined as part of the compensation plans approved by the respective environmental authority, such as
- Hectares under conservation
- Trees planted
- Connectivity
- Deforestation avoided
- Presence of species
Indicators are also defined for voluntary initiatives, such as hectares under conservation, trees planted, and carbon captured, which are previously agreed on with the different allies undertaking these initiatives (e.g., TNC, WCS, Fundación Natura).
With regard to potential impacts, the main indicators monitored include hectares intervened, volume of forest exploitation, effect on species on the IUCN Red List, and spills affecting flora and fauna.
Ecoreserves are geographically delimited areas on Ecopetrol Group’s property that are voluntarily allocated, either partially or completely, to the conservation (preservation, restoration, sustainable use, or knowledge) of biodiversity and the supply of ecosystem services, without limiting their productive and exploratory vocation. They are also part of the set of Nature-Based Solutions (SBN, by its Spanish acronym) and generally offer opportunities with multiple benefits to face challenges related to climate change, risk and disaster reduction, improvements in water security, food security, human health, and socioeconomic development, among others, on the path towards a net positive impact on biodiversity.

Short, medium,
and long-term
goals and projects
27. These 30,000 hectares correspond to the effectively restored/conserved area. Considering the area of influence of the different projects with ISA – Conexión Jaguar, WCS, Fondo Acción, Fundación Natura, The nature Conservancy, Cormacarena and Gobernación del Meta, this figure amounts to approximately 1.84 million ha.
Ecopetrol is committed to achieving Net Zero Deforestation and Net Positive Impact in its own operations and in the supply chain, for this reason it evaluates the commitments that will be defined in 2022, its scope and implications.
(304-2) (WEF 9)
Hydrocarbon activity in Colombia takes place under an environmental zoning process that applies the mitigation hierarchy, thus avoiding, minimizing, and correcting impacts on biodiversity and only offsetting residual impacts.
The main impacts on biodiversity derive from the following actions related to Ecopetrol’s operations:
- The construction or use of manufacturing plants, mines, and transportation infrastructure
- Pollution (introduction of non-naturally occurring substances into a habitat from both point and non-point sources)
- The transformation of the habitat
- Land use change
- Habitat transformation
- Pollution
In 2021, a total of
52.16 ha
were intervened, with
407.08 m3 of wood,
extracted mostly from isolated trees.
The most affected species were flora species and all interventions undertaken are reversible.
These are also subject to environmental compensation via the implementation of conservation or restoration projects by deploying the actions, modes, mechanisms, quantities, and formats enabled in each environmental management instrument.
In order to minimize these impacts, the company conducts biodiversity management processes and ecosystem services to generate the least amount and magnitude of residual impacts, based on the implementation of the mitigation hierarchy.
In compliance with the obligations of environmental compensation and investment of no less than 1% for the use of water from natural sources, the conservation of biodiversity and its ecosystem services and natural capital targets the areas prioritized by the company by entering into conservation agreements with local communities, among other actions.

2021 Management Efforts
Given the management efforts undertaken in 2021, Ecopetrol is
61% and 41% complaint
with its Biodiversity and Ecosystem Services goals by 2023 and 2030, respectively.
The highlights of the 2021 Management Efforts are28:
161
voluntary conservation
agreements were negotiated to fulfill our environmental obligations together with
166 families
in Colombia. In addition to other actions, these agreements led to the conservation of another 111 ha in 2021, and to the Company conserving and restoring
5,549 ha.
The sustainability of these actions will generate positive impacts on local and regional biodiversity and improve the productive practices of the communities involved.
Natural Climate Solutions: partnerships with TNC, WCS, Fundación Natura, South Pole, and ISA (Conexión Jaguar), with a capture potential of more than
1MtC02/año29.
One (1) Diploma Course and 10 Webinars
on Nature-Based Solutions.
The Company put together three (3) image and sound catalogs of the first three (3) eco reserves created under the initiative with the Humboldt Institute.
Four (4) books
were published with more than
3,000 new records containing genetic information of tropical dry forest species (metabarcoding -Biomoniores-Humboldt), and another four (4) books on Biodiversity and oil, Monitoring in the Colombian Amazon region, the Tropical dry forest, and the Log of the Wildlife Project.
As part of Phase II of the Wildlife Project that Ecopetrol executes in collaboration with WCS,
13 community groups
were created for the conservation of wild species;
116 sustainable productive initiatives were implemented
en 56 predios,
benefiting
383 people; ,
five (5) scientific articles were published in an indexed journal; and 12 environmental criteria were defined in search for a Net Impact on Biodiversity.
Ecopetrol joined the World Economic Forum’s 1t.org initiative to contribute to the protection of biodiversity, and the fight against the impacts of climate change through Nature-Based Solutions.
The Company committed to protect 30,000 ha, offset two (2) MtCO2, and plant 12 million trees by 2030.
Ecopetrol was selected as part of the Taskforce on Nature-related Financial Disclosures (TNFD) initiative to help prepare recommendations to manage risks and opportunities associated with natural capital.
28. This million tCO2 is equivalent to the annual potential of Natural Climate Solutions projects under development to date. The accumulated potential of these projects, taking into account their useful life, is more than 15 million tCO2.
The World Economic Fund’s 1T.Org initiative was presented for the first time at the annual meeting of the World Economic Forum in Davos, Switzerland, in January 2020, as part of the goal established by the United Nations for the restoration of ecosystems between 2021 and 2030. Today, the movement involves more than 30 global companies, including Nestlé, Pepsico, Shell, Mastercard, HP, Eni, Astrazeneca, and others.
Companies that are part of the One trillion trees movement are eligible to join if they have committed to reducing their GHG emissions in line with the Paris Climate Agreement or have set a “carbon neutrality” or “net zero emissions” goal by the end of 2050, as the Ecopetrol Group did in March 2021.

(304-1) (304-3) (WEF 9)
Ecopetrol does not report operations in protected areas categories I to IV of the International Union for the Conservation of Nature (IUCN).
Protected or restored areas of the habitats (Voluntary)
| Criterion | Unit of measurement | 2018 | 2019 | 2020 | 2021 |
|---|---|---|---|---|---|
| Protected or restored areas of the habitats (voluntary) | |||||
| Trees planted or contributed to communities, environmental authorities, or local governments | # | 75,760 | 138,620 | 462,449 | 367,276* |
| Nurseries established | # | 6 | 8 | 22 | 22 |
| Seedlings produced in nurseries | # | 28,820 | 9,000 | 90,724 | 92,868 |
| Areas planted or in restoration processes | ha | 7,832 | 3,976 | 3,201 | 2,772 |
| Number of protected water sources | # | N/A | N/A | N/A | N/A |
| Conservation agreements signed | # | 9 | 60 | 23 | 21 |
| Hectares managed under conservation agreements | ha | 11,659 | 14,127 | 14,048 | 314 |
| Area in silvopastoral systems | ha | N/A | N/A | N/A | N/A |
| Area in agroforestry systems | ha | N/A | N/A | N/A | N/A |
| Eco-efficient stoves installed | # | N/A | N/A | N/A | N/A |
| Protected areas declared under any conservation mechanism | # | 12 | 15 | 15 | 15 |
| Protected hectares declared under any conservation mechanism | ha | 16,846 | 17,675 | 17,675 | 17,675 |
| Ecological households | # | N/A | N/A | N/A | N/A |
| Photovoltaic systems | # | N/A | N/A | N/A | N/A |
| Apiaries – Meliponaries | # | N/A | N/A | N/A | N/A |
| Intervened hydrographic subzones | # | N/A | N/A | N/A | N/A |
| Kms of protected water bodies | km | N/A | N/A | N/A | N/A |
| New or improved hydrometeorological stations | # | N/A | N/A | N/A | N/A |
| Endangered wild species under conservation processes | # | 10 | 15 | 15 | 15 |
| Number of Eco-reserves | # | 1 | 2 | 6 | 15 |
| Hectares of the Eco-Reserve Network | ha | 128 | 414 | 11,906 | 15,085 |
| Protected or restored areas of the habitats (mandatory) | |||||
| Trees planted or contributed to communities, environmental authorities, or local governments | # | 9,198 | 442,350 | 220,605 | 67,470** |
| Nurseries established | # | N/A | N/A | N/A | 2 |
| Seedlings produced in nurseries | # | N/A | N/A | N/A | 21,122 |
| Areas planted or in restoration processes | ha | N/A | N/A | 5,438 | 5,549 |
| Number of protected water sources | # | N/A | 2 | 92 | N/A |
| Conservation agreements signed | # | N/A | N/A | 29 | 161 |
| Hectares managed under conservation agreements | ha | N/A | N/A | 2,045 | 2,297 |
| Area in silvopastoral systems | ha | N/A | 100 | N/A | 34 |
| Area in agroforestry systems | ha | N/A | 181 | 204 | 22 |
| Eco-efficient stoves installed | # | 235 | 72 | N/A | 5 |
| Protected areas declared under any conservation mechanism | # | N/A | N/A | N/A | N/A |
| Protected hectares declared under any<¿ conservation mechanism | ha | N/A | N/A | N/A | N/A |
| Ecological households | # | N/A | N/A | N/A | N/A |
| Photovoltaic systems | # | N/A | 20 | N/A | N/A |
| Apiaries – Meliponaries | # | N/A | N/A | N/A | N/A |
| Intervened hydrographic subzones | # | N/A | 5 | 2 | 7 |
| Kms of protected water bodies | Km | N/A | 10 | 22 | 31 |
| New or improved hydrometeorological stations | # | N/A | N/A | N/A | N/A |
| Endangered wild species under conservation processes | # | N/A | N/A | N/A | N/A |
| Number of Eco-reserves | # | N/A | N/A | N/A | N/A |
| Hectares of the Eco-Reserve Network | ha | N/A | N/A | N/A | N/A |
| Protected or restored areas of the habitats (consolidated) | |||||
| Trees planted or contributed to communities, environmental authorities, or local governments | # | 84,958 | 580,970 | 682,054 | 434,746 |
| Nurseries established | # | 6 | 8 | 22 | 24 |
| Seedlings produced in nurseries | # | 28,820 | 9,000 | 90,724 | 113,990 |
| Areas planted or in restoration processes | ha | 7,832 | 3,976 | 8,640 | 8,321 |
| Number of protected water sources | # | N/A | 2 | 92 | 0 |
| Conservation Agreements managed | # | 9 | 60 | 52 | 182 |
| Hectares managed under conservation agreements | ha | 11,659 | 14,128 | 16,093 | 2,611 |
| Area in silvopastoral systems | ha | N/A | 100 | N/A | 34 |
| Area in agroforestry systems | ha | N/A | 181 | 204 | 22 |
| Eco-efficient stoves installed | # | 235 | 72 | N/A | 5 |
| Protected areas declared under any conservation mechanism | # | 12 | 15 | 15 | 15 |
| Protected hectares declared under any conservation mechanism | ha | 16,846 | 17,675 | 17,675 | 17,675 |
| Ecological households | # | N/A | N/A | N/A | 0 |
| Photovoltaic systems | # | N/A | 20 | N/A | 0 |
| Apiaries – Meliponaries | # | N/A | N/A | N/A | 0 |
| Intervened hydrographic subzones | # | N/A | 5 | 2 | 7 |
| Kms of protected water bodies | Km | N/A | 10 | 22 | 31 |
| New or improved hydrometeorological stations | # | N/A | N/A | N/A | 0 |
| Endangered wild species under conservation processes | # | 10 | 15 | 15 | 15 |
| Number of Eco-reserves | # | 1 | 2 | 6 | 15 |
| Hectares of the Eco-Reserve Network | ha | 128 | 414 | 11,906 | 15,085 |
Note: In the line of “seedlings produced in nurseries,” the number reported in 2021 is associated with Nurseries and plantings, and it is the first year that this information is broken down for Ecopetrol S.A.
* Although there is a decrease of 95,000 planted trees between 2020 and 2021, during 2021 initiatives related to Natural Climate Solutions were matured that will enable the planting of nearly one million trees (250,000 TNC, 230,000 PVS and 6000,000 Natura) through of three agreements that were signed at the end of the year. The planting of these trees will be reflected in the results presented in 2022 and 2023.
**The reduction in the number of planted trees was due to the fact that the execution of these plantings were subject to the execution schedules presented to the Environmental Authority and approved by it. These schedules had for the years 2019 and 2020, the highest execution figures for the establishment of reforestation or planting. In 2021, according to the schedules, contractual planning activities for restoration programs were carried out, which are expected to be executed in 2022.

The goal for 2021 was four (4) million trees, accumulated as a Group, and the voluntary contribution of 367,276 trees allowed Ecopetrol to exceed that goal.
This last information only corresponds to Ecopetrol S.A., and it is lower than the number in 2020. The figure does not necessarily have to increase every year, although the Group’s goal of six (6) million trees by 2023 and 12 million by 2030 remains the same.
Total number of species on the IUCN Red List and on national conservation lists, whose habitats are located in areas affected by the organization’s operations
| Species | Unit of measurement | 2018 | 2019 | 2020 | 2021 |
|---|---|---|---|---|---|
| Critical hazard | # | N/A | N/A | N/A | 1 |
| Endangered | # | N/A | N/A | N/A | 1 |
| Vulnerable | # | N/A | N/A | N/A | 2 |
| Near threatened | # | N/A | N/A | N/A | 2 |
| Least concern | # | N/A | N/A | N/A | 1 |
- There were seven (7) operational incidents greater than one barrel, totaling 157.8 barrels spilled, affecting water bodies and/or vegetation.
- Fauna and flora were affected in three (3) of the seven (7) incidents.
The species affected in these cases are reported below:
- One (1) Critically Endangered (CR) species, 230 individuals.
- One (1) Endangered (EN) species,
- 30 individuals.
- Two (2) Vulnerable species (VU),
- 11 individuals.
- One (1) Near Threatened (NT) species,
- 80 individuals.
- One (1) Near Threatened (NT) mammal species, 2 individuals.
- One (1) Least Concern (LC) terrestrial habit reptile species, 11 individuals.
The commitment to biodiversity includes the following elements:
Required commitment from own operations and the supply chain to avoid operational activities in the vicinity of World Heritage areas and IUCN Category I-IV protected areas.
Application of the mitigation hierarchy (avoid, minimize, restore, and offset) when operating in areas close to critical biodiversity.
Work with the following external partners to fulfill the commitment:
- Fundación Natura: conservation and restoration of tropical forest ecosystems and freshwater wetlands in the Middle Magdalena region and actions to mitigate GHG emissions.
- WCS and Fondo Acción: focused on implementing conservation actions around 15 species and three (3) landscapes.
- TNC: develops a carbon monitoring protocol for restoration projects.
- Conexión Jaguar Program – ISA: GHG mitigation, biodiversity conservation, community participation.
- Cormacarrena: conservation of forests in the upper and middle basin of the Guayuriba and Metica rivers by means of payments for ecosystem services.
- Alexander Von Humboldt Institute: technical knowledge in socio-ecological planning, biodiversity baselines, and planning and development of eco-reserve networks.
- ANDI: biodiversity conservation in the Andean-Amazonian region.
- South Pole: Natural Climate Solutions and management of the carbon project portfolio for GHG compensation.
In the 2020 report, there were no Natural Climate Solutions goals related to monitored hectares, and the goal of trap cameras for biodiversity monitoring was eliminated upon achieving
100% de compliance.
Ecopetrol has established environmental criteria for the selection of contractors, and in terms of Biodiversity. The Company has 12 criteria intended to minimize the impact on the supply chain, including the following:
In 2022, an assessment will be conducted to define the scope, potential targets, and potential implications of commitments such as Net Zero Deforestation and Net Positive Impact for the operational activities and the supply chain..
Biodiversity Exposure and Assessment
Ecopetrol evaluates its operations to determine the level of exposure of biodiversity in its areas of influence
| Biodiversity exposure and assessment | Number of sites | Area (Hectares) |
|---|---|---|
| Total number of sites and total area used for operational activities | 130 | 2,201,972 |
| Biodiversity impact assessments for sites used for operational activities in the last five years | 130 | 2,201,972 |
| Sites and total area evaluated in the last five years that are remarkably close to critical biodiversity | 4 | 191,72 |
| Sites evaluated that are in close proximity to critical biodiversity with biodiversity management plans | 4 | 191,72 |

Roadmap
Circular Economy
Outstanding
Material Element
Sustainable Development Goals

| Impacted stakeholder groups | Areas responsible for managing the impacts | Ecopetrol segments that generate the greatest impact |
|---|---|---|
| Suppliers | The entire Company | Upstream |
| Associates and Partners | Midstream | |
| Clients | Downstream | |
| Employees | Comercial | |
| Investors | ||
| State | ||
| Society and Community |
Why is the
element material?
Circular economy is a cross-cutting enabler that contributes to the fulfillment of goals associated with the energy transition, the goal of zero net carbon emissions, the reduction of the water footprint, the closing of the materials and waste cycle, and the management of natural capital. This element generates opportunities for growth, innovation, job creation, and the conservation of biodiversity and ecosystem services. Considering the foregoing, and its importance for stakeholders, Circular Economy is an outstanding element for Ecopetrol.
The implementation of the circular economy model allows the Company to:
(i)
Promote efficiency in the use of materials, water, energy, and the recovery capacity of ecosystems.
(ii)
Identify initiatives for the development of new business models with economic, environmental, and social benefits.
(iii)
Promote innovation, technology, and research of new products and services.
How is the material
element managed
The Roadmap for this element includes five (5) lines of action:
Strengthening of skills and knowledge generation
Generate the necessary skills to promote circular economy models in the Company.
Circularity in the supply chain
promotes circular initiatives in the procurement of goods and services and in the relationship with suppliers.
Circular initiatives bank
Identification and follow-up on the circular initiatives of Ecopetrol Group.
Circularity metrics
Implement quantitative and qualitative metrics to measure progress with respect to the Company’s circularity.
Circularity criteria
Allows the incorporation of circularity criteria in operational, financial, commercial, and supply procedures.
How is the material
element evaluated?
As part of the Roadmap, the company establishes goals, management indicators, and milestones to be achieved in the short, medium, and long term. Depending on their relevance, some of these are included in the different instances defined by the company’s HSE management system, such as:
Follow-up on the update of the circular initiatives bank to monitor its progress and implementation status in the different areas of the company.
Calculation of the social, environmental, and economic benefits of the circular initiatives implemented.
Measurement of the participation level of professionals in skill strengthening courses.
Measurement of qualitative and quantitative circularity metrics to determine the Company’s level of maturity regarding this subject.
Monitoring is conducted on a monthly basis in the HSE Vice Presidency Committees and those involving the Vice Presidency of Projects and Drilling. The Vice Presidency of Production’s (VDP) Committee also monitors progress in this regard.
Short, medium,
and long-term goals
and projects
Short term: 0 to 2 years
- Calculation of environmental, social, and economic benefits for 100% of the initiatives implemented.
- Implementation of 100% of circular business and prioritized industrial symbiosis cases.
- Circular economy qualitative and quantitative measurements.
- Incorporation of circular criteria in operating, commercial, financial, and supply procedures.
Medium term : 3 to 5 years
- Implementation of 100% of circular business and prioritized industrial symbiosis cases.
- Strengthening of basic skills for 100% of the selected population.
Long term : longer than 5 years
- Implementation of 100% of circular business and prioritized industrial symbiosis cases.
- Substitution of new raw materials for secondary or renewable materials.
- Strengthening of advanced skills for the selected population.
2021 Management Efforts
Circular initiatives bank
297 initiatives associated with:
- Decarbonization 49%
- Waste 29%
- Water 16%
- Materials 5%
- Biodiversity less than 1%
Strengthening of skills
1,296 workers were trained in the “Introduction to Circular Economy” basic virtual course, and 121 people in intermediate courses on the following topics:
Basic concepts to formulate circular projects
Financial model of circular projects
Systems thinking and application in circular processes
Circularity Criteria
Circularity criteria were included in the guidelines of the Vice Presidency of Projects and Drilling to include sustainable eco-designs in engineering projects, from the conceptual to the detailed phase. This, in order to mitigate environmental impacts and contribute to the closing of cycles, in line with the principles of circular economy and the decarbonization, water, biodiversity, and waste goals, among others.
Circularity in the supply chain
The implementation of the circular economy model in the supply chain in 2021 led to the following results:
- Materials showcase and lending: platform to post the materials no longer required by Ecopetrol, also accessible by subsidiaries.
- Buy back: incorporation of a model, in the procurement planning phase, to offer the possibility to repurchase the asset once its useful lifespan has expired. This avoids waste and generates income from the sale of the asset once it is no longer required. These revenues amounted to COP 6.9 million in the 2018-2021 period.
- Chemical Leasing: In September, UNIDO (United Nations Industrial Development Organization) recognized Ecopetrol as a leading Company in the implementation of Chemical Leasing, which consists of shifting from the purchase to the payment for service of chemical products.
The certification was obtained by presenting the financial and environmental benefits of the catalyst procurement strategy for the Cartagena Refinery, and the chemical treatment strategy for the Cartagena Refinery and the Apiay Operations Management. - Reincorporation of waste in infrastructure: First contractual model for ferrous waste to be used by a third party as raw material for infrastructure works at Ecopetrol S.A. warehouses.
- Green Clause: 27 updated clauses and incorporation of environmental criteria for the selection of partners in engineering, operation, and maintenance strategies and refining chemical treatments.
- Circular initiatives in food: use of the wasted arising from food preparation at the cafeterias for composting or vermiculture purposes. Analytics in production forecasts, among others, to use 83% of this waste throughout the country.
Circularity maturity level
By means of this line of action, Ecopetrol will periodically assess the implementation progress of the Circular Economy Model using qualitative and quantitative metrics.
(i)
Qualitative: internally establishes the level of circularity maturity by determining to what extent the principles of circular economy (systems thinking, innovation, responsible management, collaboration, value optimization, and transparency), are implemented throughout the Company’s current decisions and activities.
(ii)
Semi Qualitative-Quantitative: external measurement to report information in a standardized manner and with a score to measure progress and understand where the Company is in the transition towards a circular economy, by comparing itself with other companies.
(iii)
Quantitative: framework of indicators based on an evaluation of the flow of materials with other indicators related to resource efficiency and effectiveness, economic investment, and technological incorporation in circular initiatives.
In this sense, the following standards were defined as circularity metrics to start gradually and progressively measuring them as of 2021.
Circularity metrics
| Qualitative | Semi Qualitative – Quantitative | Quantitative |
|---|---|---|
This measurement will be taken using the GTC 314:2020 standard (which corresponds to an identical adoption of the BS8001-2017 standard) enacted by ICONTEC in November 2020.  | Circulitycs was selected for this measurement, which is a tool developed by the Ellen MacAthur Foundation, a pioneer in Circular Economy.  | Mix of indicators according to different standards (e.g.: WBCSD, Ellen MacArthur Foundation, ISO 59020, or others). |
Below are the results for 2021:
1
Preparation of the first qualitative measurement of circular economy, whose results rank Ecopetrol at Level 3 (Committed) according to Colombian Technical Guide (GTC, by its Spanish acronym) 314:2020. The measurement scale comprises four (4) levels, where zero (0) is the basic level of legal compliance and level four (4) is the highest, in which companies innovate in their business model and in the ways they create value.
2
Based on this measurement, a work plan is structured to close gaps with the operational and support areas.
3
The percentage of circularity of the materials used in catering contracts was calculated, with a circularity of 70%; and the transformation of ferrous waste, with 50%. The international reference guide used was the Circular transition indicators v2.0 – Metrics for business by business of the World Business Council for Sustainable Development (WBCSD).
4
Bituminous material (MBL, by its Spanish acronym) from sludge or oily residues as asphalt binder for the improvement of low-traffic roads. In 2021, Ecopetrol received the Phase I results from the research currently underway with the UIS, with promising laboratory results to produce MBL bituminous materials for the construction of road surface improvement layers.
Out aspiration in 2022 is to conduct the Semi – Qualitative – Quantitative measurement using the methodology of the Ellen MacArthur Foundation with Circulytics.
Use of energy and
alternative sources
Outstanding
Material Element
Sustainable Development Goals


| Impacted stakeholder groups | Areas responsible for managing the impacts | Ecopetrol segments that generate the greatest impact |
|---|---|---|
| Suppliers, contractors, and their workers | VCM | Upstream |
| Clients | VDS | Midstream |
| Investors and Shareholders | VRP | Downstream |
| National State | VDP | Comercial |
| Local State | ||
| Society and Communities |
Why is the
element material?
The use of energy and alternative sources responds to the identified expectations of stakeholders and global trends, which is part of the Growing in the Energy Transition and Generating Value with TESG pillars of the 2040 Strategy.
How is the material
element managed?
To address this element, short, medium, and long-term goals have been established for the incorporation of Non-conventional Renewable Energy Sources (FNCER, by its Spanish acronym), which are measured in the context of decarbonization with GHG reduction. Since 2018, the Energy Efficiency Program (PEE, by its Spanish acronym) has set the guidelines for the management of the Company’s energy performance. The lines of action defined for the management of this material element are as follows:
(i)
Operational control
(ii)
Technological enhancement
(iii)
Integration to Ecopetrol processes
With regard to Non-conventional Renewable Energies (NCRE), Ecopetrol seeks energy self-sufficiency through diversification. The Company is focused on diversifying its energy matrix, with the progressive incursion into non-conventional sources of renewable energy such as solar, wind, and geothermal technologies, and has a maturing portfolio in other technologies such as biomass and small hydroelectric plants. The objective is to leverage the demand for electrical energy from Company operations, i.e., its self-generation scheme, as well as potential requirements arising under the low-carbon hydrogen strategic plan.
How is the material
element evaluated?
Self-generation
Energy efficiency
Routine burning
The initiatives under the first two (2) lines are evaluated according to the following criteria:
Energy saving
Optimized energy consumption compared to the baselines established in the processes. The percentage reduction is given with respect to the 2017 energy demand baseline.
Reduction of CO2 emissions
Tons of CO2 emissions stopped associated with the optimization of consumption.
Cost optimization
The costs associated with the optimization of energy consumption are quantified according to the rate of energy consumed.
Goals and projects in the short,
medium, and long term to manage the
“Use of Energy and Alternative Sources”
material element
Incorporation of MW of renewable energy in the Company’s energy matrix:
- 2023: 400 MW
Investments in renewable energies as a percentage of the Company’s total CAPEX:
- 2025: 10%
Reduction of electrical energy consumption compared to the 2017 baseline:
- 2023 a 2028: 6%
- + 2028: +6%
Routine flaring:
- 2030: Zero routine flaring.
2021 Management Efforts
In terms of energy efficiency, the savings and production of CO2 emissions are as follows:
Savings and production of CO2 emissions
| Segment | Savings (MMCOP) | Energy savings (MW) | Energy savings (GBTU) | Production emissions (TonCO2e) |
|---|---|---|---|---|
| Upstream | 8.34 | 4.2 | 920 | 51,849 |
| Downstream | 14.27 | -0.4 | 1,330 | 76,734 |
| Midstream | 2.10 | 0.7 | -15 | 46 |
| Total | 24.71 | 4.5 | 2,235 | 128,629 |
Note: Data cutoff date November 2021, and projections December 2021
Until 2021, the energy efficiency program focused on the implementation of operational control measures. Ecopetrol is currently maturing and ensuring the CAPEX resources required for the implementation of the necessary technological improvement projects to reach the 2028 goal in all segments of the value chain.
Energy consumption within the organization
| Consumption of fuels arising from renewable or non- renewable sources within the Company | Unit of measurement | 2020 | 2021 |
|---|---|---|---|
| Total consumption of fuels from renewable sources in GWh | GWh | 65,4 | 54,6 |
| Total consumption of fuels from non-renewable sources in GWh | GWh | 3,030 | 2,813* |
| Total | GWh | 3,095.4 | 2,867.6 |
*The reduction in the total consumption of fuels from non-renewable sources is due to two (2) factors: (i) Less discharges from the VRO, which had an impact of around 260 GWh/year, and (ii) Less consumption in the refineries, at approximately 90 GWh/year.
Energy consumption of the different types of energy purchased
| Energy consumption of the different types of energy purchased, excluding steam | Unit of measurement | 2020 | 2021 |
|---|---|---|---|
| Electricity consumption | GWh | 2,425 | 2,309.84 |
| Heating consumption | GWh | – | – |
| Cooling consumption | GWh | – | – |
| Total | GWh | 2,425 | 2,309.84 |
Energy consumption of the different types of self-generated energy
| Energy consumption of the different types of self- generated energy, excluding steam | Unit of measurement | 2020 | 2021 |
|---|---|---|---|
| Self-generated electricity | GWh | 1,612 | 1,515 |
| Self-generated heating | GWh | – | – |
| Self-generated cooling | GWh | – | – |
| Total | GWh | 1,612 | 1,515 |
[srcl lang=”en” ]Commercial and Marketing Vice Presidency
[/src]
Energy consumption of the different types of energy sold
| Energy consumption of the different types of energy sold, excluding steam | Unit of measurement | 2020 | 2021 |
|---|---|---|---|
| Electricity sold | GWh | 94 | 81.58 |
| Heating sold | GWh | – | – |
| Refrigeration sold | GWh | – | – |
| Total | GWh | 94 | 81.58 |
Self-generated and sold steam
| Self-generated and sold steam | Unit of measurement | 2020 | 2021 |
|---|---|---|---|
| Self-generated steam | klb | 23,962,888 | 22,276,124 |
| Steam sold | klb | 17,520 | 17,520 |
Total energy consumption
| Total energy consumption within the Company | Unit of measurement | 2020 | 2021 |
|---|---|---|---|
| Total energy consumption within the Company | GWh | 7,226.4 | 6,551 |
| Total energy consumption of steam in klb | klb | 23,945,368 | 22,293,644 |

Energy consumption and costs of energy consumption
| Energy consumption and costs of energy consumption | Unit of measurement | 2018 | 2019 | 2020 | 2021 |
|---|---|---|---|---|---|
| a) Non-renewable fuels purchased and consumed | MWh | 4,597,000 | 5,119,000 | 4,665,232 | 4,268,536 |
| b) Non-renewable electricity purchased | MWh | 2,414,000 | 2,300,000 | 2,049,000 | 2,309,840 |
| c) Steam/heating/cooling and other purchased non- renewable energies | MWh | – | – | – | – |
| d) Total renewable energy purchased or generated | MWh | 91,959 | 88,200 | 65,889 | 54,551 |
| e) Total non-renewable energies sold | MWh | 70,200 | 73,431 | 84,470 | 81,582 |
| Total non-renewable energy consumption (A+B+C-E) | MWh | 6,940,800 | 7,345,569 | 6,629,762 | 6,496,794 |
Note 1: The data above cover 81% of operations. This percentage does not include associates.
Note 2: Total energy consumption costs are calculated by subtracting the income generated (energy sold) from total energy purchase costs, using a Market Representative Exchange Rate (TRM, by its Spanish acronym) of COP 3,693 per USD.
The total non-renewable energy consumption goal for 2021 was
7,377,800 MWh.
Ecopetrol’s effective management efforts ensured that the operations met the goal according to the defined range, and that they remained below that target.
Energy intensity
| Energy intensity ratio | Unit of measurement | 2021 |
|---|---|---|
| Energy consumption | KWh | 4,498,319,441 |
| Barrels produced | bbls | 4,230,032,541 |
| Energy intensity ratio | kWh/bbl | 1.063 |
Note: The type of energy used to calculate the energy intensity ratio is electricity.
Reduction of
Energy Consumption
In 2021, the reduction in energy consumption was
2.49886E+15 J.This includes reduction in energy consumption of fuels and electricity. The methods used for calculation are the following:
(i)
Savings from operational control: savings are calculated according to the ISO50001 standard, establishing energy management indicators with respect to energy consumption baselines.
(ii)
Savings from technological enhancements:
a. Establishing theoretical savings: assuming a fixed percentage value of savings from a base consumption, experimental results, and simulations.
b. Calculation of periodic savings: a base consumption is determined (through measurements or simulations) and the real energy consumed is measured at periodic intervals; this difference is determined as the savings that will be updated at the established frequency.
c. Savings according to ISO5001: savings and energy management indicators are calculated with respect to energy consumption baselines.
(iii)
Savings from IIE management: savings are established according to the optimization of the energy intensity index obtained with the Solomon methodology.
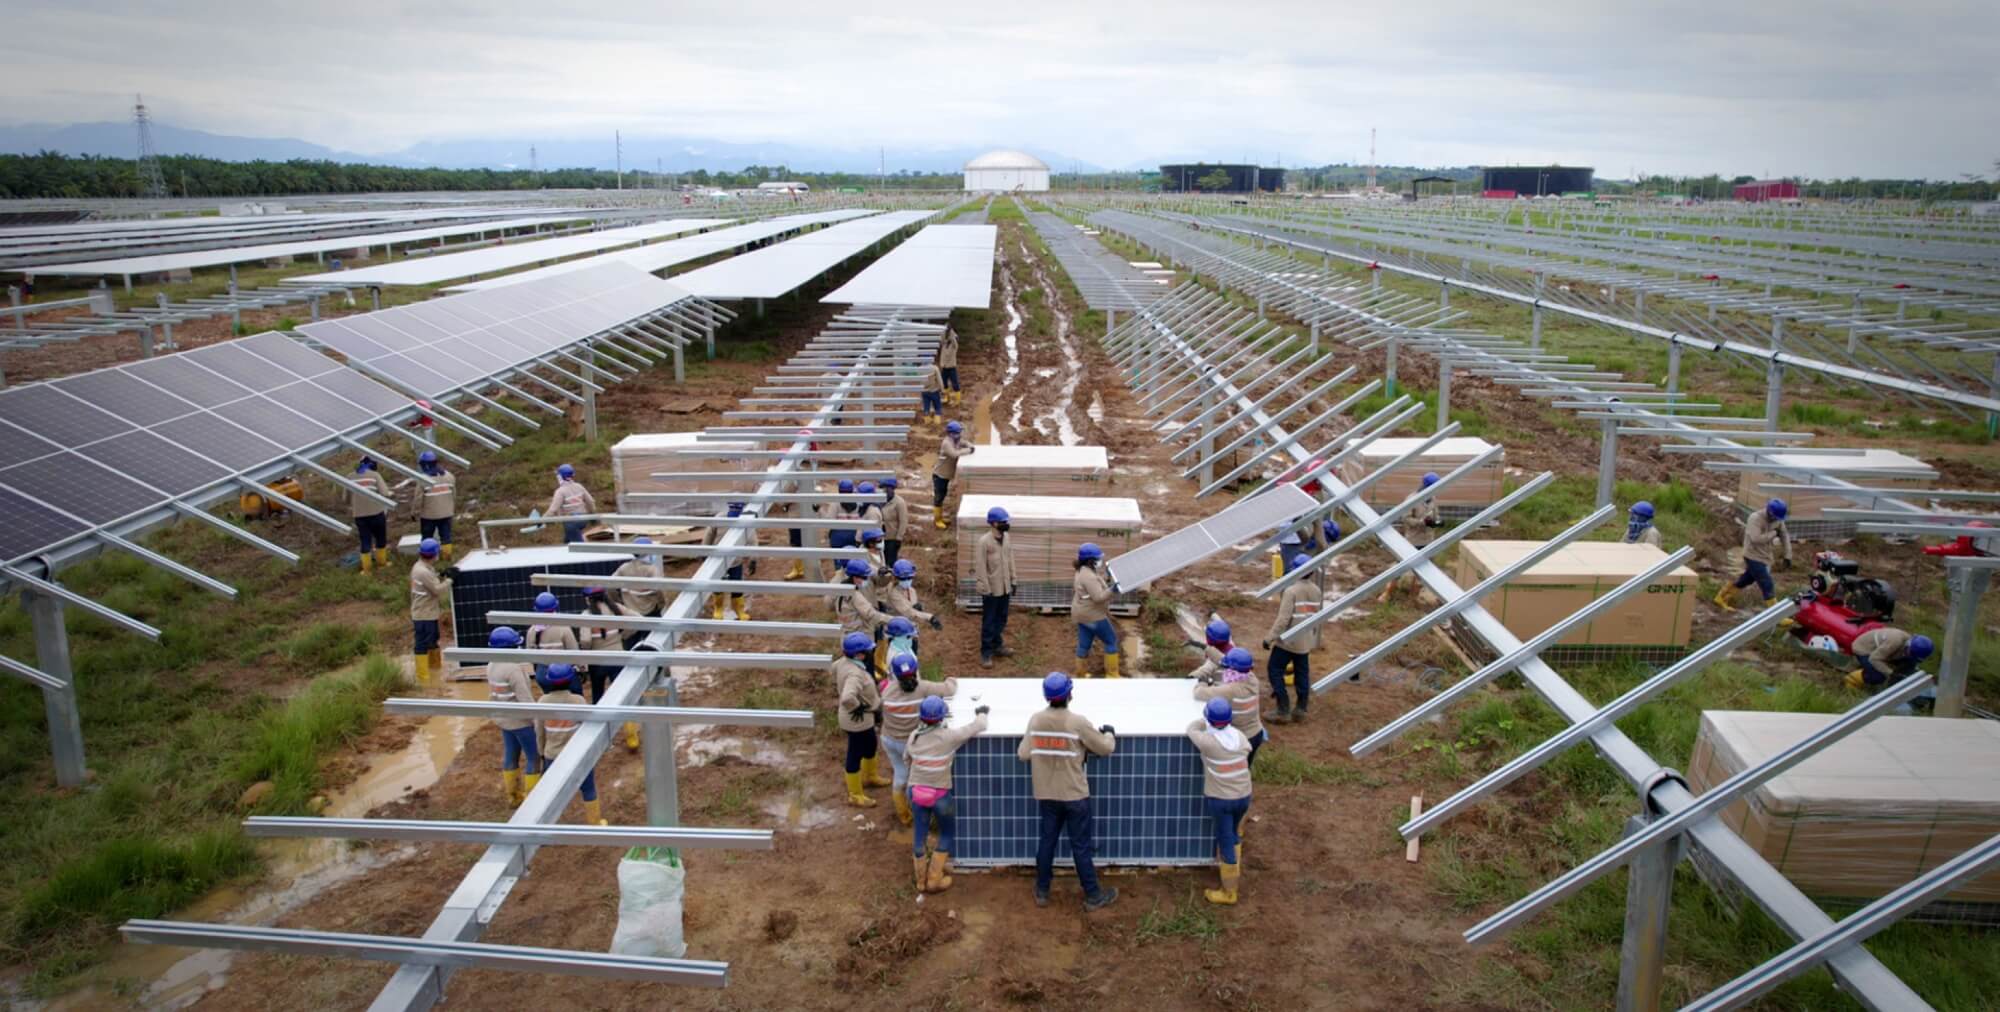
Non-conventional
Renewable Energies
In 2021, the San Fernando Solar Ecopark was inaugurated in the department of Meta (Colombia), with an installed capacity of 61 MWp. It is managed by Cenit, and it consists of more than 113,000 panels with bifacial technology to capture energy on both sides, and followers that will allow them to move according to the position of the sun. For this initiative, more than 150 women were hired at the peak of construction.
The Company initiated the call for tender to select a partner for the construction of the Rubiales Ecopark, in the Department of Meta, with an estimated installed capacity of 87 MWp. The energy produced will serve to supply part of the demand of the Rubiales field, owned by Ecopetrol.
Investment in Renewable Energies
| Investment in renewable energies | Unit of measurement | 2021 |
|---|---|---|
| Amount invested in first generation biofuels | COP | 2,114,433,922.00 |
| Percentage invested in renewable energies | % | 8.70 |
Commercial
At the end of December
75 borders
were served (+7 compared to 2020), with average monthly energy of
204.4 GWh
(+11.4% compared to 2020) via Ecopetrol Energía SAS ESP.
COP 18,000 million
were generated from the sale of the surplus energy of the Group.
Energy sales to Esenttia began with a tender awarded to Ecopetrol Energía, covering approximately
12 GWh-month
in two commercial frontiers.
The sale of energy to the Nare, Jazmín and Moriche frontiers began, which was incorporated into the Group’s energy demand due to the termination of the Mansarovar operating contract with approximately
6 GWh-month.
Long-term energy purchases made with Enel Green Power for the 2023-2036 period through EES, guaranteeing an energy supply of
569.4 GWh-year (65MW)
to the Group, and also being the contract with the best price in the portfolio.
In 2021, Ecopetrol Energía S.A.S. ESP (EES) conducted the Demand Aggregator activity to offer support to generators through the Voluntary Disconnectable Demand (DDV, by its Spanish acronym) mechanism, generating coverage for
555 MWh
and total revenues of
COP 553 million
for Ecopetrol.
RCSA’s (Proeléctrica S.A.S. ESP) service contract for the representation of self-generation surplus was concluded, which will allow estimated savings of approximately
COP 350 million
in 2022 vs. the previous provider’s rate.
The contract for the sale of self-generation surpluses between VAO Sur (Orito and la Hormiga) and Enerco S.A. ESP was extended, which allows the business to secure a sales price that covers the generation costs and the regulated costs of the market, with a profitability of
COP 19.4 /kWh.
A VPN of
COP 1,800 billion
is estimated for these revenues.
Planning and infrastructure
- In 2021, the Reforma – San Fernando 230 kV power transmission line came into operation. This will increase electrical reliability in the Orinoquía Region.
- The battery storage initiative in Tello was commissioned, with a capacity of 0.8 MW and a backup time of three (3) minutes.
- Short-term planning was established to support the weekly programming for the Upstream, which allowed the use of the commercial strategy of an integrated portfolio, with benefits between COP 5,100 and COP 7,300 million during the period.
- The information centralization initiative was redefined for four
(i)
Preparation
(ii)
Connectivity and standardization
(iii)
Datamart and integration
(iv)
implementation in planning, programming, and dispatch
Phase 0 closed in 2021, and Phase 1 began with the signing of the ANS with Operational Planning.
- The natural gas power generation microturbine in Yaguará (1.6–2.2 MW) came into operation.

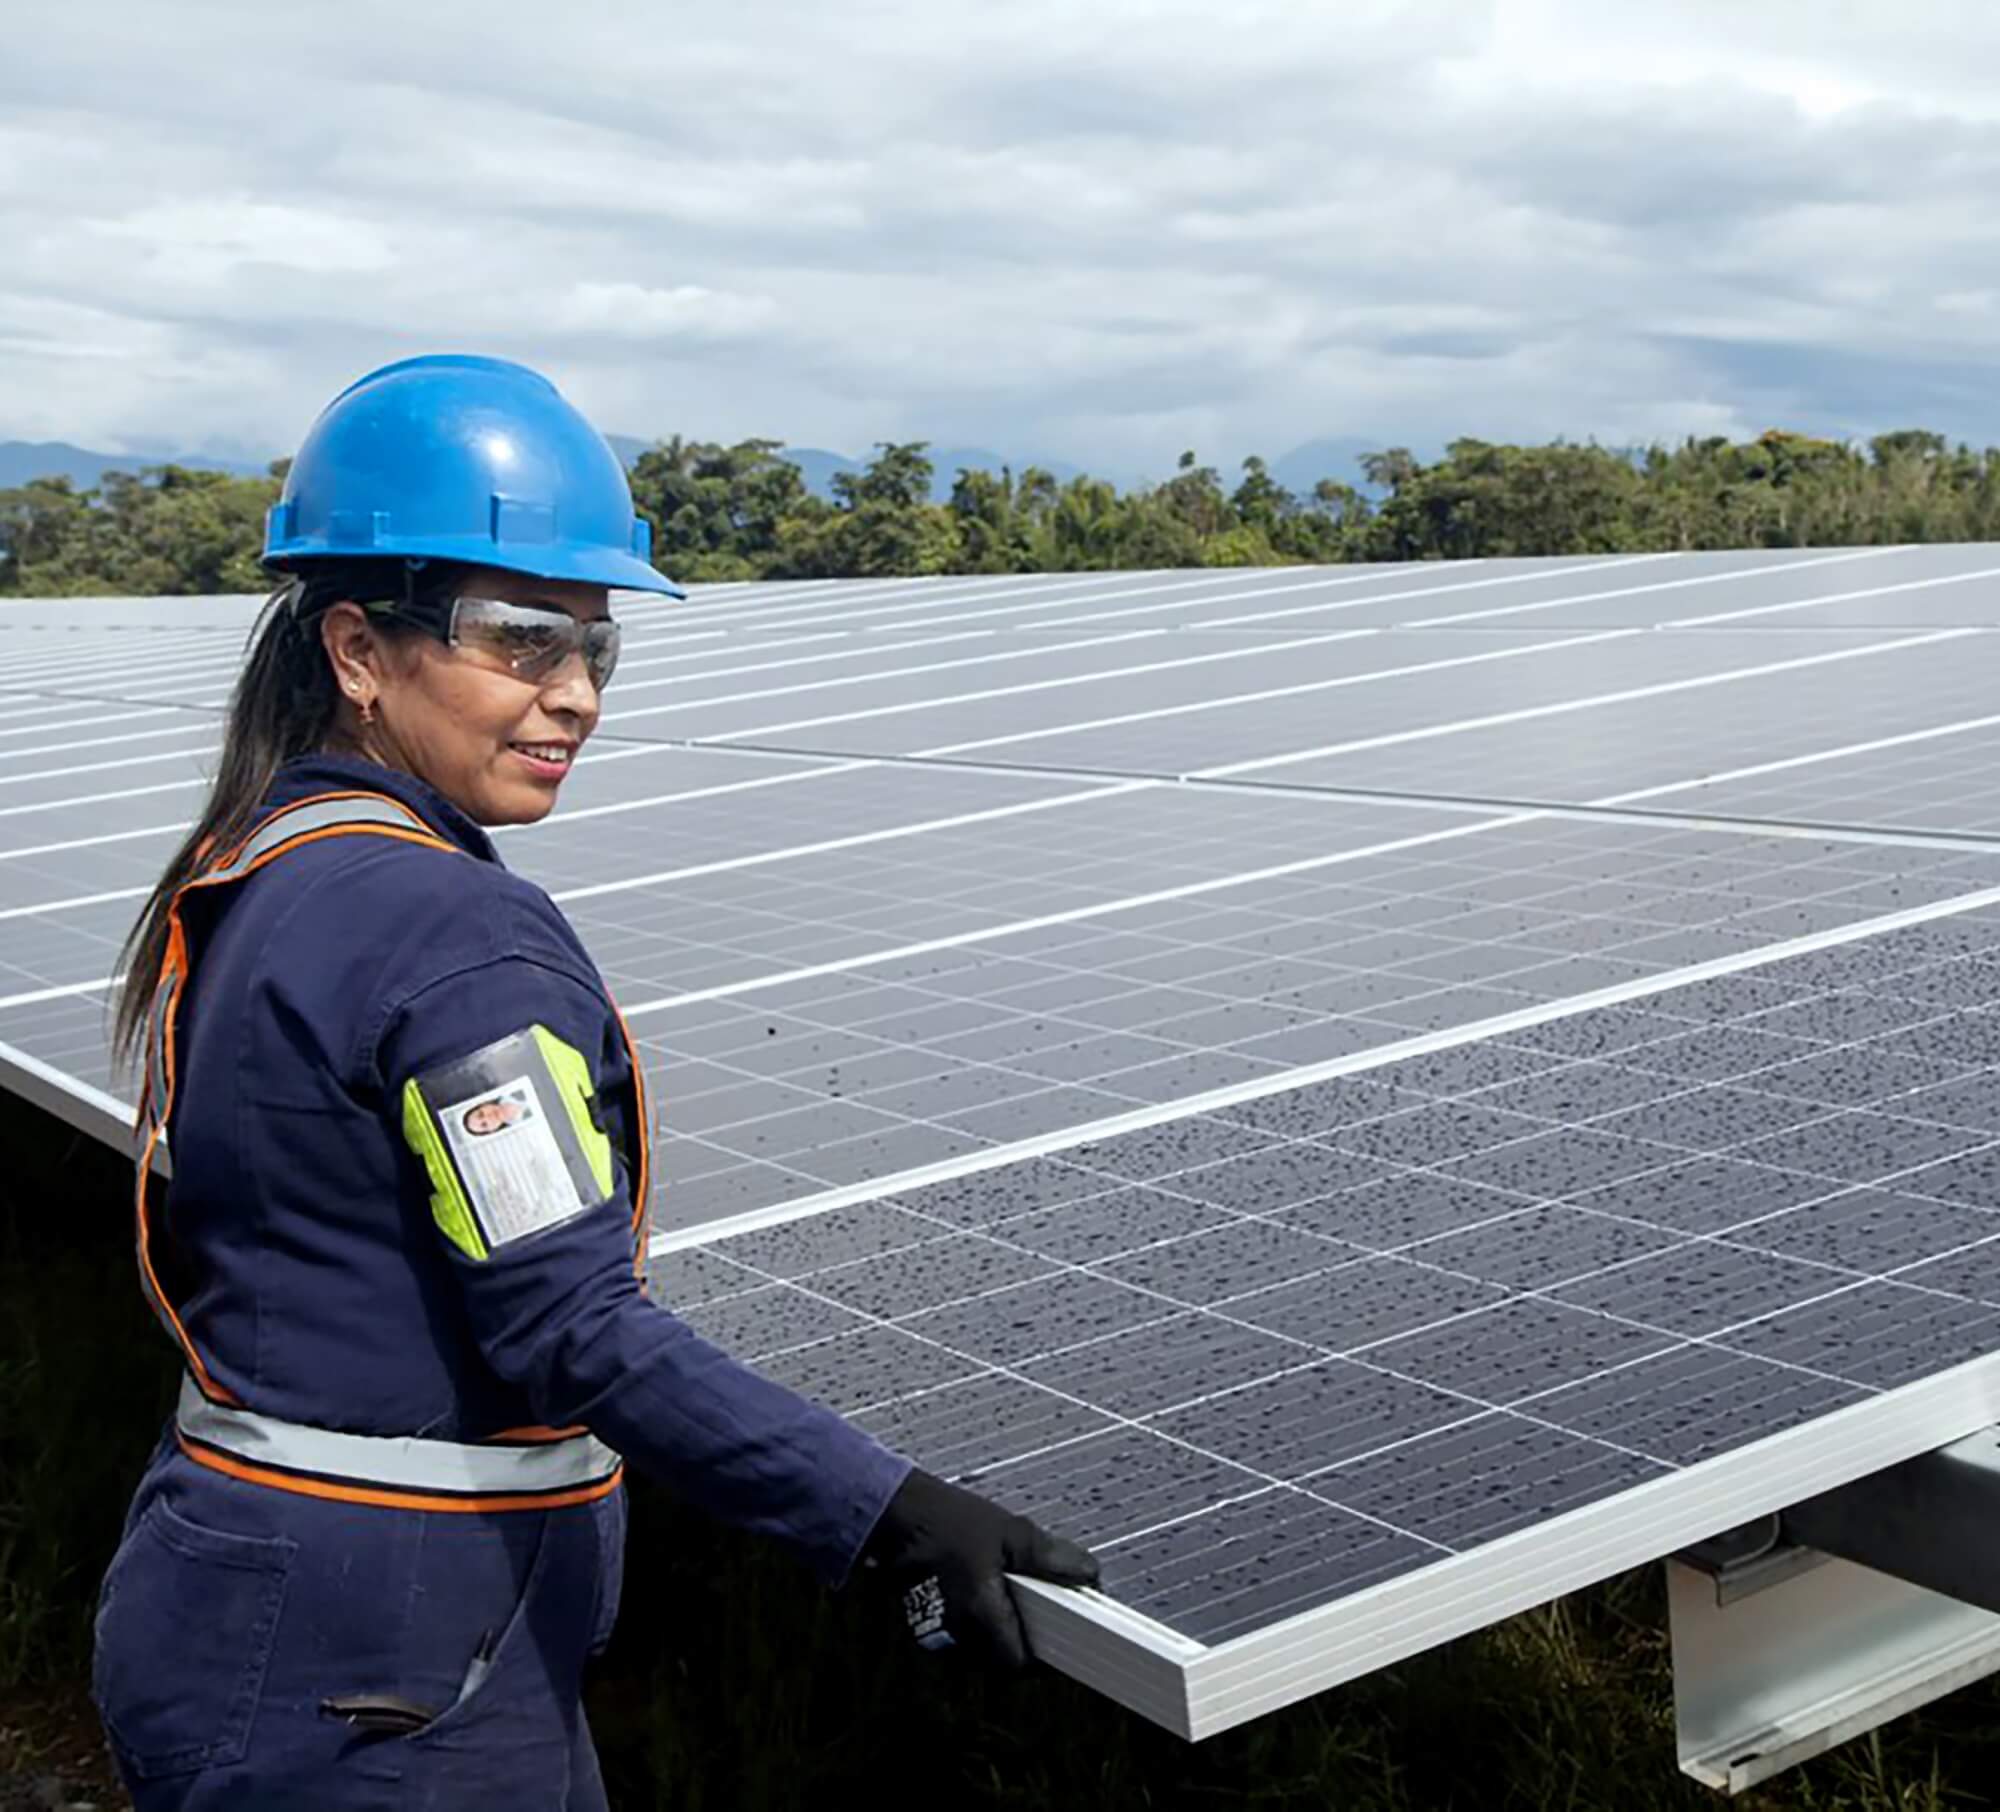
Battery Storage
The implementation of energy storage began in Campo Tello 57, with the purpose of reducing the number of deferred barrels due to electrical faults associated with external causes. The installed technological solution includes a backup capacity and time of
0.8 MW and
three (3) minutes.
Since its commissioning in September 2021, it has prevented
about eight (8) events per month,
representing a reduction of deferred barrels for this external cause. Between 2019 and 2021,
the reduction went from 0.48% to 0.17%
deferred barrels
for this external cause.
Geothermal activities
The Company continues to make progress in the maturation of the candidate wells in the Cubarral Block in the department of Meta, and it is starting a heat utilization evaluation in Cravo Norte with operating partner Sierracol.
Wind potential measurements continue in Casablanca, Araguaney, Huila, and Ballena, as well as wind self-generation initiatives with third parties on the Atlantic Coast.
With regard to Small Hydroelectric Power Plants, environmental due diligence processes and connection studies are underway. In 2021, information requests were filed with local and regional entities.
Main R&D results related
to the material issue of energy
use and alternative sources
Determination of carbon stock values in aerial biomass, necromass, and soil; evaluation of the potential of Morichal as a strategic system for capturing CO2 in the Colombian Orinoquía region.
Experimental design and FAT tests of the electrolyzer for the electrolytic and/or green hydrogen production pilot.
Ecopetrol scaled up the production of asphaltene oxides and coke in 1.8- and 5-liter reactors.
First prototype of a supercapacitor based on activated carbon with a high surface area obtained from asphaltenes activated with KOH.
Pipe coating based on an MDI pre-polymer and asphaltene oxide.
Ecopetrol synthesized materials based on activated carbon for the removal of phenols in industrial waters.
The company developed additives from carbon precursors and composite materials for the construction industry.
Pilot-scale production of hydrophobic polyurethane foam to remove grease and oil from production waters (< 1 ppm).
Roadmap
Fuel Quality
Outstanding
Material Element
Sustainable Development Goals

| Impacted stakeholder groups | Areas responsible for managing the impacts | Ecopetrol segments that generate the greatest impact |
|---|---|---|
| Society and Community | VCM | Midstream |
| State | VDS | Downstream |
| Clients | VHSE | Comercial |
| Investors | VRP |
Why is the
element material?
The Energy Transition and the discussions associated with climate change addressed at COP26 have contributed to deepening the trend towards greater use of renewable energy sources and alternative fuels. This phenomenon is generating changes in the context, including new fuel quality requirements and greater restrictions on emissions and environmental regulations.
Air quality has become a priority for different stakeholder groups, including the State, society, and communities, and it is increasingly relevant for clients and investors, whose stance increasingly rewards diversification. Ecopetrol’s commitment to deliver cleaner fuels precedes this growing interest and it is part of the Company’s strategic vision. For this reason, in the materiality assessment, the efforts focused on improving and ensuring fuel quality were identified as an outstanding material element.
The Company recognizes the interrelationship of this material element with others such as Air Quality and Climate Change.
How is the material
element managed?
Gasoline quality
Diesel quality
How is the material
element evaluated
Ecopetrol monitors the quality of the fuels produced and delivers products to clients from the refineries and the different stations and delivery points to the wholesaler, ensuring that the quality is met according to regulations. Ecopetrol has quality laboratories at its refineries and at Cenit, which is responsible for transporting said fuels to Ecopetrol’s wholesale clients.
Short, medium, and long
term goals and projects
- 2022: produce gasoline with a sulphur content of less than 50 ppm,
- 2023: produce diesel with a sulphur content of less than 15 ppm
- 2025: produce diesel with a sulphur content of less than 10 ppm
- 2030: produce gasoline with a sulphur content of less than 10 ppm and an octane number greater than 88
Biofuels
- 2022 – 2030: Execution of pilots for the production of biofuels
2030 onwards
- Continuous production of biofuels via co-processing or with dedicated plants
- Wide diversification of the refined portfolio
- Possible development of synthetic fuels
- ICP Research – Universidad Pontificia – Politécnico Jaime Isaza Cadavid AMVA – Complete two (2) projects for a deeper analysis of air quality issues due to re-suspended particulate matter in the Valle de Aburrá metropolitan area in Medellín, Colombia.
- Determine Transmilenio emission factors in the city of Bogotá, Colombia – In collaboration with the ICP, the emissions in grams per kilometer of the vehicle technologies in the Transmilenio trunk fleet will be measured.
2021 Management Efforts
In 2021, Ecopetrol invested
USD 5 million
in projects aimed at improving fuel quality at the Barrancabermeja Refinery. These include the expansion of the processing capacity of the HCM U2650 Moderate Hydrocracking Unit, the purchase of laboratory equipment, and the technological enhancement of the HCM plant-Phase I.
Maintenance activities and technological updates were implemented at the Barrancabermeja Refinery, which improved the quality of the components used for the preparation of regular motor gasoline. The average sulphur content in regular motor gasoline was
61 ppm
(average as of November 2021).
In 2021, the sulphur content in diesel remained
at en promedio en 13 ppm on average,
despite the maintenance work conducted on the processing units at the refineries and the increased consumption at the national level.
The start-up of the project to improve the quality of naphtha in U-107 at the Cartagena Refinery was approved. This will allow the adaptation of the refining infrastructure to achieve gasoline production with a sulphur content of
less than 10 ppm
before 2030, as set forth in Resolution 40103.
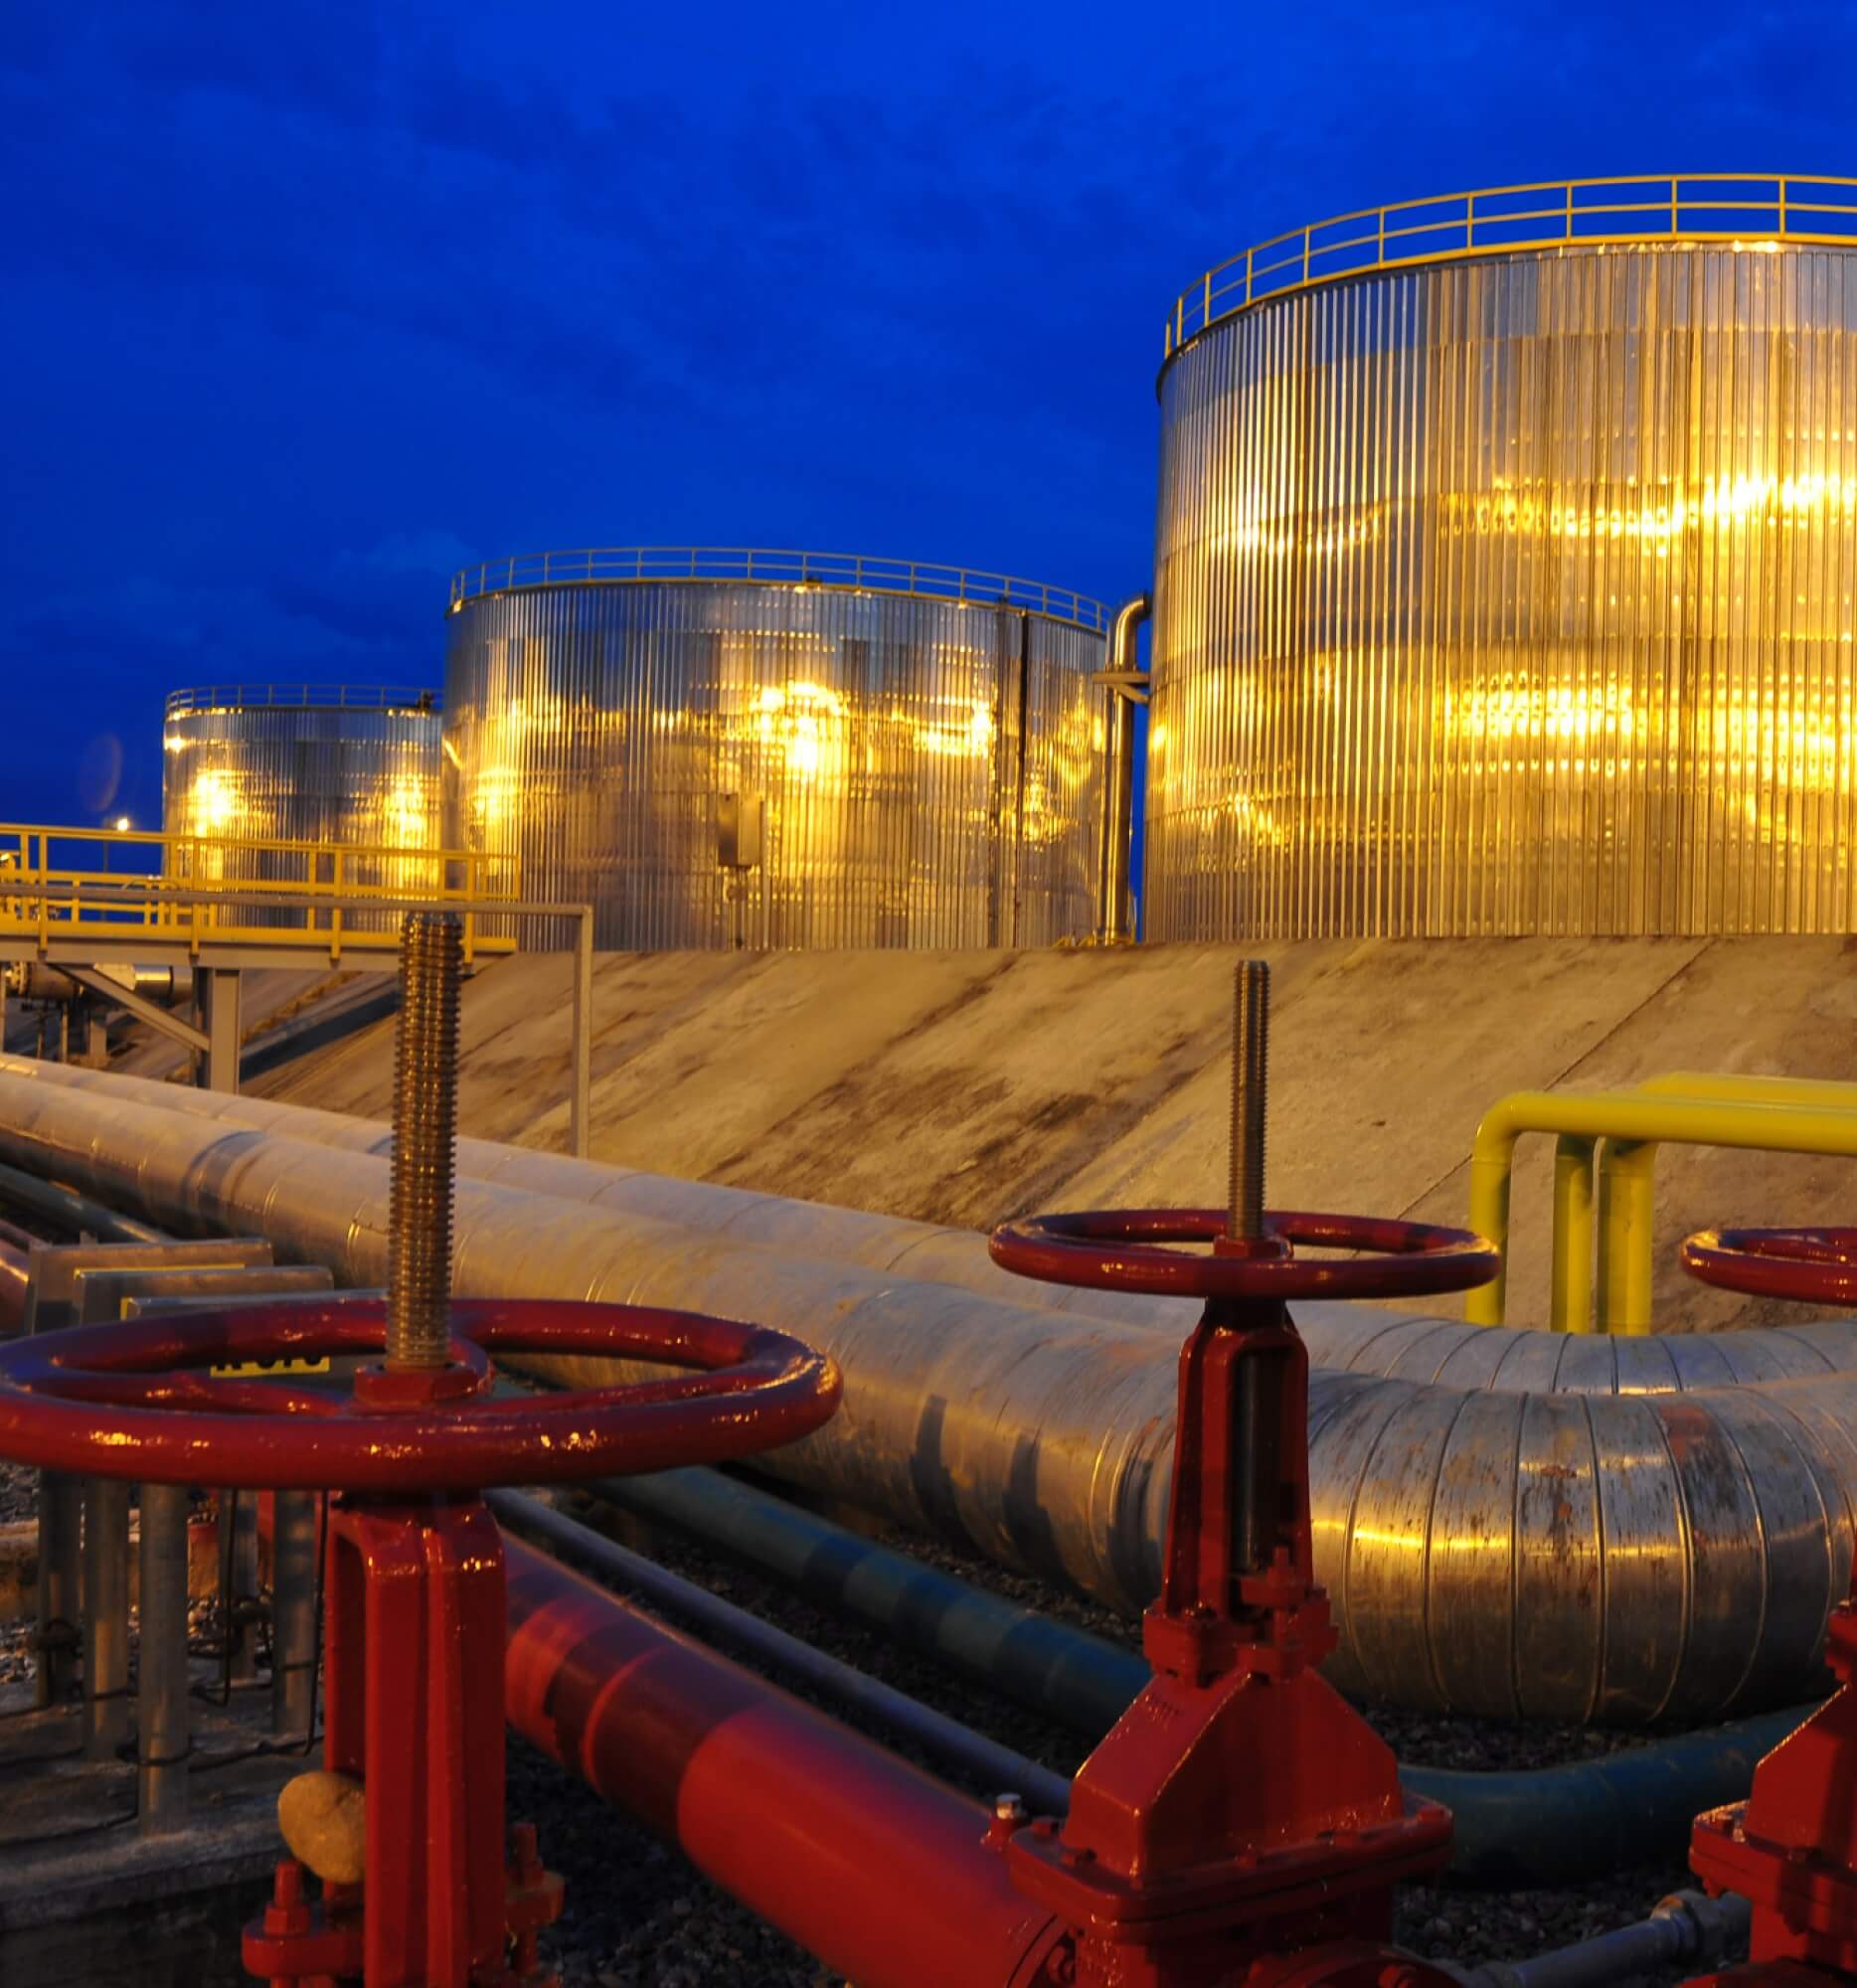
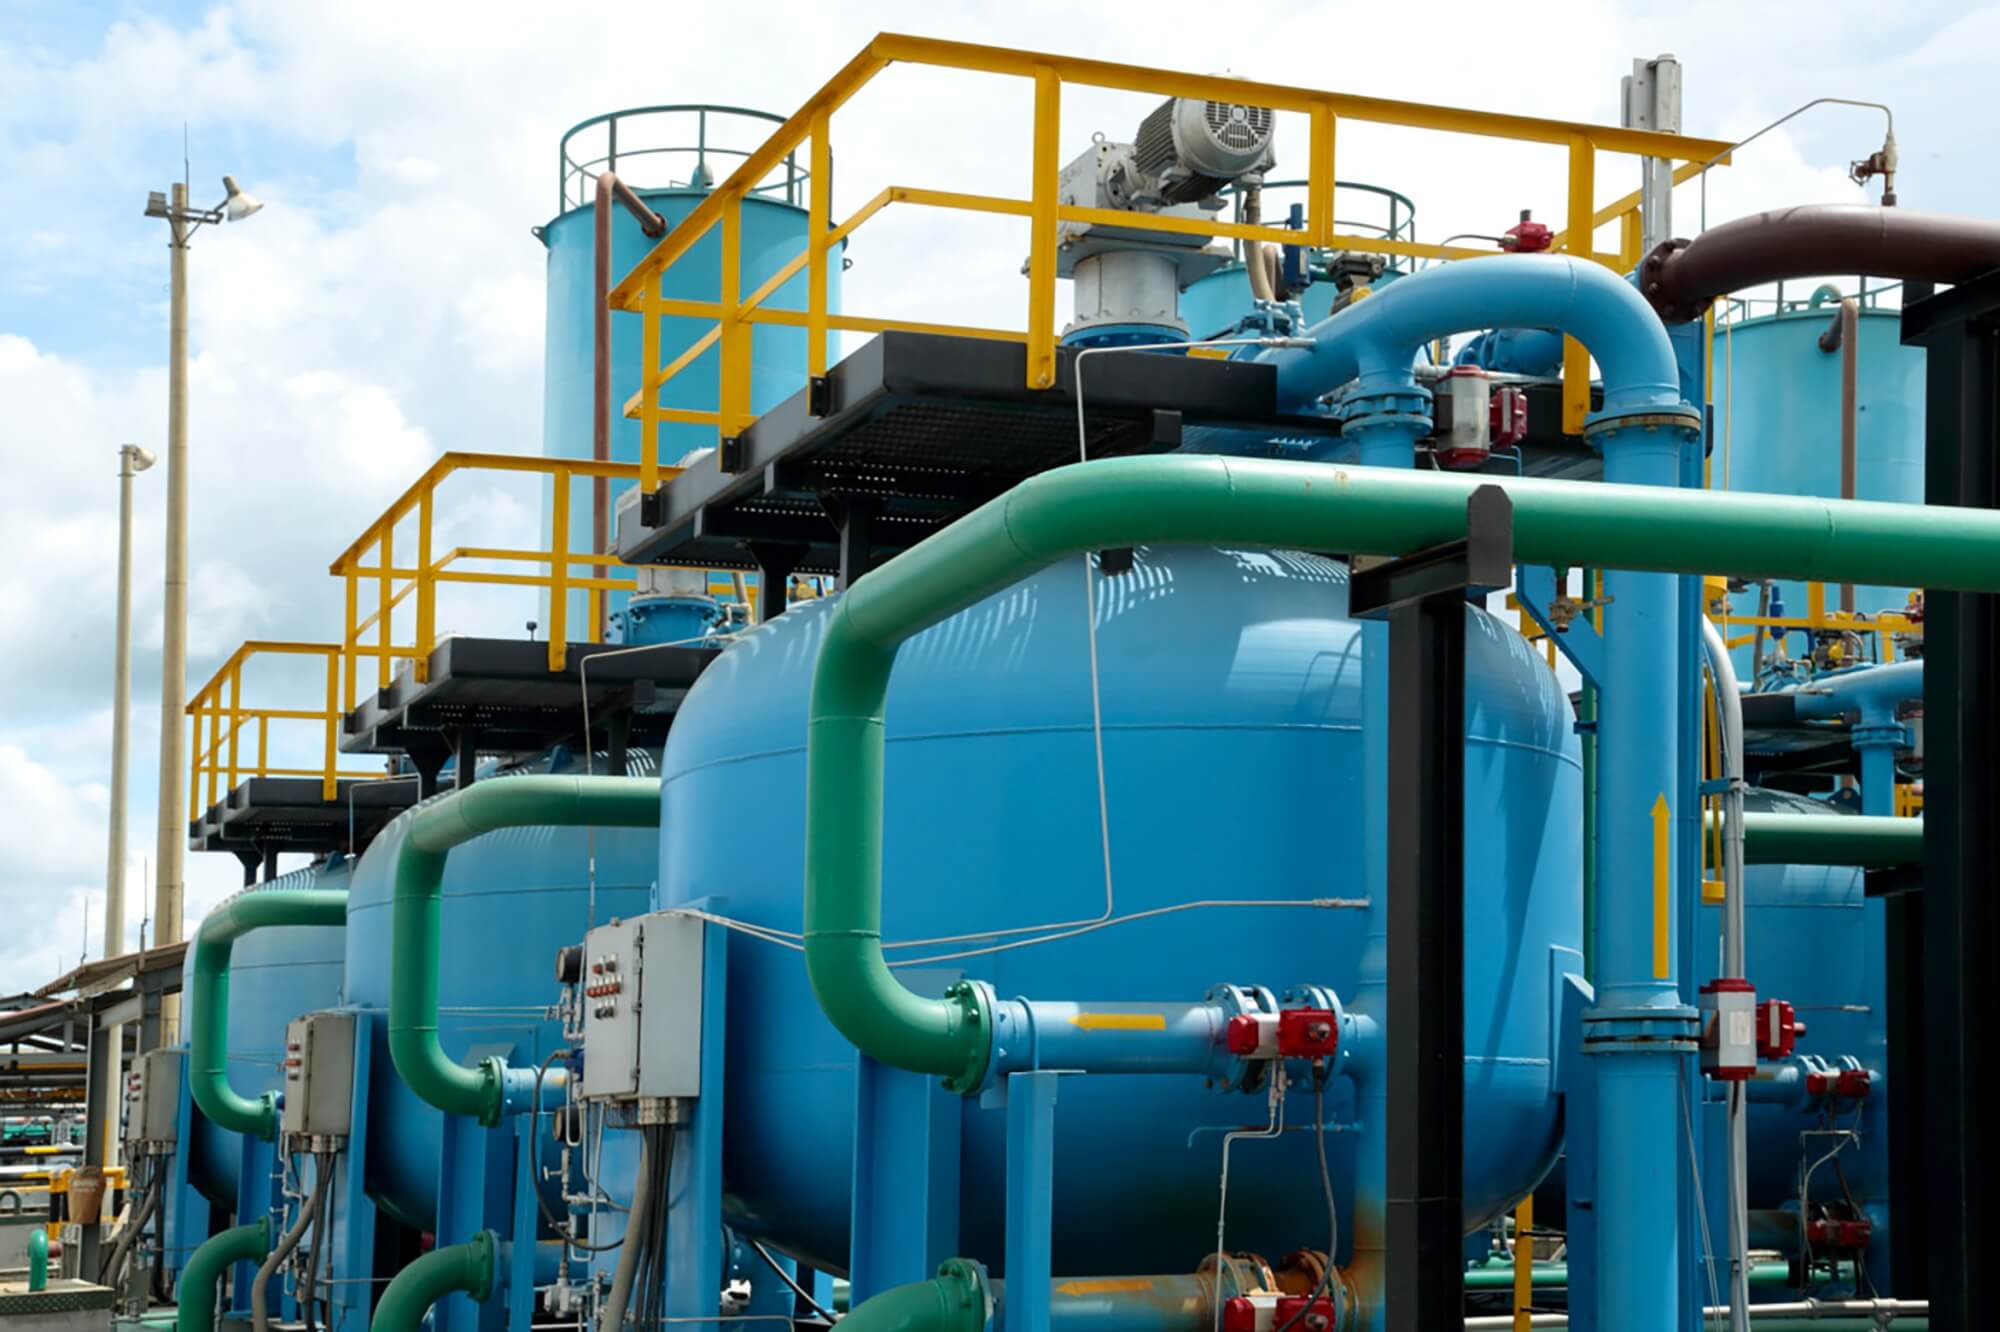
Networking spaces with vehicle manufacturers and importers to strengthen partnerships to make the product portfolio of the refineries more attractive
- Reviewing alternatives to reduce sulphur<15ppm
- Ensuring product availability throughout the chain
- Granting customers longer payment terms to maintain inventories
- Invest in a communications fund to promote the product
- The pre-feasibility study continued to identify alternatives for the Company to achieve fuel quality comparable to world benchmarks and capture profitable growth opportunities in the target market. Viable alternatives were identified at the Barrancabermeja Refinery, within the scope of the Refining Development Program, to improve gasoline and Diesel quality.
Biofuels volume30

This has allowed the Company to meet the requirement of preparing and supplying diesel with
2% biofuel content,
to wholesale clients, in accordance with the provisions of current quality regulations.
R&D related to fuel quality
GRB fuel route:
- The process configuration for diesel and gasoline was defined based on commercial technologies.
- The co-processing of vegetable oils of up to 30% were included in the scheme for the production of renewable fuels diesel line, and we also defined the design for industrial testing.
Fuel reformulation study and its impact on air quality
Together with Universidad de los Andes de Colombia, Transmilenio, and the Mayor’s Office of Bogotá, Ecopetrol assessed air quality improvement in Bogotá. This identified a 78% reduction of particulate matter, thanks to the renewal of the Phase 1 and 2 bus fleet, the incorporation of diesel <10 ppm sulphur content, and the use of vehicular natural gas.
Roadmap
Air Quality
Outstanding
Material Element
Sustainable Development Goals


| Impacted stakeholder groups | Areas responsible for managing the impacts | Ecopetrol segments that generate the greatest impact |
|---|---|---|
| Society and Community | VHSE | Midstream |
| Employees | Downstream | |
| Comercial | ||
| Upstream |
Why is the
element material?
Ecopetrol, as a relevant player in the oil and gas industry, made a commitment to the country to help preserve the air quality around its operations for the well-being of citizens and the protection of the environment.
In 2021, Air Quality was identified as an outstanding element in the materiality assessment, for which the “Clean Air for the Environment” Roadmap was built.
Ecopetrol’s operations must monitor and control the emission of pollutants (particulate matter, carbon monoxide, sulphur and nitrogen oxides, and volatile organic compounds -VOCs) that affect air quality to keep them within limits that do not affect the air quality surrounding its operations.
How is the material
element managed?
The Air Quality Roadmap: “Clean Air for the Environment” includes the following strategic lines:
Prevention
Based on standards and best practices pertaining to pollutant emissions, permanent monitoring in sensitive and prioritized areas, and implementation of technologies and design criteria in fixed sources to monitor, control, and reduce emissions
Mitigation
Have an updated and verified atmospheric emissions inventory, monitoring programs at relevant points of the operation, both for air quality and the measurement of emissions from fixed sources, definition of reduction goals and a portfolio of reduction initiatives prioritized by major emission sources.
Collective action
Implementation of research and technological development programs through intersectoral and interinstitutional actions to improve air quality.
How is the material
element evaluated?
- This is evaluated using the following elements:
Monitoring of air quality by measuring emissions and monitoring and modeling of air quality in the surroundings of the operation to determine the contribution of own emissions.
Reduction goals for defined criteria pollutant emissions, with permanent monitoring.
Follow-up of the implementation of the portfolio of initiatives to reduce emissions, leveraged on best operating practices, control technology, monitoring and surveillance of emissions and technological reconversion of processes.
This portfolio includes:
- Annual projection for the reduction of criteria pollutants based on GHG emission reduction initiatives under the decarbonization plan.
- New specific initiatives to reduce pollutants based on adjustments or technological conversions of key operating processes.

Short, medium, and long-term
goals and projects
- Updated emissions inventory identifying Company key assets.
- Definition of emission reduction goals for production and refining criteria pollutants in 2022.
- Definition of operational and technological standards in terms of pollutant emissions
2030
- Achieve the reduction goals of criteria pollutant emissions based on the following
- Implementation of GHG reduction initiatives.
- Execution of the SOx emission control project at the Barrancabermeja refinery
- Structuring and execution of initiatives to mitigate fugitive emissions from VOCs, and venting in tanks, and industrial wastewater treatment systems.
2050
- Implementation of a technological initiatives portfolio for the frequent monitoring of the most relevant emissions to ensure air quality in the operation, according to the guidelines of the World Health Organization (WHO) by 2050.
2021 Management Efforts
In 2021, the Air Quality Roadmap was formulated and approved based on:
Strategic lines for mitigation, prevention, and collective action.
The start of the purification process of the criteria pollutant emissions inventory in the SAP-EC tool, which includes the following:
Update of emission factors based on installed technologies and the measurement of fixed sources.
Review and inclusion of new sources and inactivation of sources associated with out-of- service equipment.
Assurance of the information loading process with a cross-cutting team responsible for periodic monitoring and analysis of the emissions inventory.
Estimated impact on air quality from decarbonization initiatives (reduction of GHG emissions).
Other significant air emissions
(305-7) (WEF 7E)
| Emissions | Unit of measurement | 2018 | 2019 | 2020 | 2021 |
|---|---|---|---|---|---|
| NOx | kt | 25,76 | 28,09 | 28,78 | 28,30 |
| SOx | kt | 16,93 | 17,52 | 14,79 | 14,81 |
| Persisten organic pollutans (POPs) | kt | ||||
| Volatile Organic Compounds (VOCs) | kt | 106,69 | 113,8 | 116,35 | 111,64 |
| Hazardous air pollutants (HAP) | kt | ||||
| Particulate Matter (PM) | kt | 1,57 | 1,70 | 1,53 | 1,40 |
| Other air emission categories identified in relevant regulations | kt | 11,06 | 11,32 | 11,70 | 11,50 |
Note: Carbon monoxide (CO) emissions are reported in the emissions table under “Other air emission categories identified in relevant regulations”.
The emission factors used for the calculation of criteria pollutants (NOx, SOx, particulate matter, and carbon monoxide) and volatile organic compounds (VOC) are mainly drawn from document AP-42 of the United States Environmental Protection Agency (EPA).
In some particular cases, emission factors were taken from the following references:
- The Regional Association of Oil and Natural Gas Companies in Latin America and the Caribbean (ARPEL, by its Spanish acronym): Atmospheric Emission Inventory Methodologies in the Oil Industry, 1999
- European Environmental Agency: (EEA)EMEP/EEA Air pollutant emissions Inventory guidebook 2019: technical guidance to prepare national emission inventories
- EIIP Vol II Ch 14 Uncontrolled emission factor listing for Criteria Air Pollutants – Emission Inventory Improvement Program July 2001
Under the category of other relevant air emissions, carbon monoxide (CO) emissions are also reported.
Persistent organic compounds (POPs) are not part of the Company’s raw materials, supplies, or product portfolio, so it is not necessary to record potential emissions of this compound category, and hence, no related emission estimates are reported.
Hazardous air pollutants (HAP) are managed from the occupational perspective by means of an epidemiological surveillance system implemented in specific areas, so as to identify risk areas and exposure groups, as well as their appraisal, the impact assessment related to the health of workers, and the proposal of prevention, management, and control alternatives. The most relevant substances are aromatic hydrocarbons and solvents, whose emissions are reported as part of the emissions inventory of volatile organic compounds (VOC) and sulphur oxides reported as SOx.

In 2021, there were operational changes that affected NOx, SOx, CO, and PM emissions compared to previous years, including the following:
Transfer of operations from the mid-stream to Cenit since May 2021, which meant that these emissions were not reported as part of Ecopetrol S.A.
Reduced operation in the Cracking Units (FCCs), mainly at the Cartagena Refinery, due to a three- month (3) scheduled maintenance that mainly affected PM and SOx emissions.
Reduced energy self-generation at the Barrancabermeja Refinery, previously intended for the Central Regional Production Vice Presidency, which was replaced with external supply.
Reduced industrial wastewater treatment in the Castilla field upon closing the discharge to the Guayuriba River in the first half of 2021.
Optimization / reduction of energy self-generation with liquids in the Rubiales Field.
GHG reduction initiatives, mainly related to energy optimization, the electrification of operations, fuel substitution, and the reduction of flaring.
Increased emissions due operations in the Floreña field throughout the 12 months of the year vs. 10 months in 2020 (operation received in March 2020).
Production, imports, and exports of Ozone Depleting Substances (ODS)
| Emissions | Unit of measurement | 2018 | 2019 | 2020 | 2021 |
|---|---|---|---|---|---|
| ODS emissions | t | 0.82 | 1.32 | 1.32 | 0.19 |
Note: Ecopetrol S.A. does not produce, export (neither in bulk nor in products that contain them) or sell these substances; the Company has only purchased equipment that contains these substances from various suppliers, such as air conditioners, stationary refrigerators, and fire-fighting systems, and others, and it is therefore not an importer or exporter of this type of substances.
Ozone Depleting Substance (ODS) loads of the equipment category (SAO)
| Equipment category | Unit of measurement | 2018 | 2019 | 2020 | 2021 |
|---|---|---|---|---|---|
| Small domestic/commercial applications (Load between 0 and 5 lb or 0 and 2.3 Kg) | # | 1,181 | 678 | 678 | 94 |
| Medium and large commercial applications (Load between 5 and 15 lbs. or 2.3 and 6.8 Kg) | # | 110 | 86 | 86 | 220 |
| Industrial applications (Load greater than 15 lb or 6.8 Kg) | # | 411 | 619 | 619 | 223 |
| Total | # | 1,702 | 1,383 | 1,383 | 537 |
Note: ODS emissions are reported using the advanced level 2 method of the Intergovernmental Panel on Climate Change (IPCC), and the Ozone Layer Depletion Potentials are reported in the Montreal Protocol manual.The substances used for calculation are the following ODS: CFC-12, HCFC-22.
Substitute ODS substances used in refrigeration and firefighting systems are not included in the calculation, as they have zero ozone depletion potential.
UPCC’s Advanced Level 2ª Method (bottom up). The bottom-up approach considers the time interval between consumption and emission explicitly through emission factors. This is based on the number of products and end uses where chemical substances are consumed and released. With this approach, actual annual emissions are estimated based on the number of equipment units using these chemicals, the average load of the substance, the average service life, emission rates, recycling, and disposal considerations, among others. This method was selected because, although Ecopetrol S.A. is a consumer of ODS substances or their substitutes, the Company does not produce, export (neither in bulk nor in products that contain them), or sell these substances; the Company has only purchased the equipment that contains them from various suppliers (e.g., air conditioners, stationary refrigerators, and fire-fighting systems).
For the calculation of ODS emissions, in the case of blends and other ODS substances, the emission factors recommended by the IPCC are considered
(FE 1% for units with a load of less than five (5) Lb,
FE 17% FE 17% for units with load greater than five (5) Lb).
The emissions inventory purification process ended in 2021 included the updated emission factors of the catalytic cracking and sulphur recovery units at the refineries, based on the emission control technologies installed and the results of direct measurements (isokinetic studies) taken by accredited third parties. This implied that the emission values previously reported from 2018 to 2020 were adjusted.
Comprehensive
waste management
The Comprehensive Waste Management strategic pillar was defined in 2021 under the Environmental Management Strategy, and it is articulated with the Ecopetrol Group’s Circular Economy model. This pillar focuses on measures to strictly comply with the national regulatory framework and on reduction and use activities in pursuit of continuous improvement.
(306-2) (WEF 12E)
Within the framework of comprehensive waste management, the following prevention, reduction, and use actions have been implemented:
Application of environmental criteria for the selection of suppliers.
Use of rubble in road maintenance and to fill gullies.
Inclusion of green contractual clauses to avoid waste generation or allow maximum waste reduction or use.
Use of non-hazardous catalysts from cracking units.
Use of wood from pallets and crates in warehouse operations.
Management plan for single-use containers and packaging in the case of packaged products placed on the market.
The following measures have also been implemented for the contribution of waste towards circularity:
For the chemical treatment service, the Company uses chemical leasing to return leftover products and packaging to suppliers.
Post-consumer agreements: Waste deriving from electrical and electronic equipment and lighting and lead acid batteries handed over to suppliers.
Composting of organic waste from catering and food services – 69% circularity index.
Sale of metal scrap to steel mills to be reincorporated into production processes – 50% circularity index.
Of the hazardous waste generated at Ecopetrol (especially in production and refining activities)
90 % is oily sludge,
for which the following actions have been incorporated into Ecopetrol’s Comprehensive Waste Management Guide for the specific treatment of this waste:
Identification of initiatives to reduce the generation of oily sludge.
Centrifuge treatment to recover oils from sludge and reduce their volume and danger.
Sludge treatment under the bioremediation technique that accelerates the total or partial degradation of the contaminant, reducing its concentration to a harmless state.
Tratamiento térmico coprocesamiento, que permite incluir los lodos como parte del material combustible en hornos cementeros, reduciendo sustancias que no es posible tratar ni confinar.
Disposal in security cells is also an option in case the waste cannot be treated and requires special confinement.
Additionally, at the segment level, the following measures are being implemented for oily sludge:
Additionally, at the segment level, the following measures are being implemented for oily sludge:
Production: tank and vessel maintenance program to prevent oily sludge volumes from increasing and being difficult to remove, as well as technologies to minimize the amount of fluid present in the sludge, such as dehydration and centrifugation processes for oil recovery.
Refining: sending oily sludge to a third party to be used in co-processing in cement kilns (clinker production).
Refining and Production: research on the use of efficient emulsion breakers in produced wastewater treatment to prevent the generation of oily sludge and the use of sludge as asphalt binders
(306-2) (WEF 12E)
Pursuant to the provisions of the Comprehensive Waste Management Guide and Good Sustainable Supply Practices, Ecopetrol ensures compliance with contractual and legislative obligations by the third parties who handle or manage its waste based on the following considerations:
- Preparation of technical specifications that include regulatory environmental obligations, description of the required service, and contractual obligations.
- Environmental criteria for the selection of suppliers.
- Application of the processes set forth in the contracting manual to select the third party that is to provide the service. Market intelligence, show room, definition of the criteria and requirements of the service, and technical and commercial evaluation of the bidders.
- Green clause.
- Verification of environmental licenses authorizing the treatments and/or processes for use and final disposal, issued by the competent environmental authority.
- Verification of environmental permits or authorizations required for engaging in the activity (for example, discharge permit and water concession), if necessary for the treatment process offered.
- Visits to the third party’s facilities to ensure that the waste treatment processes and infrastructure offered comply with the provisions set forth in their environmental license and that they meet the necessary requirements for treatment.
- Follow-up by applying the External Waste Inspection
- Format established in Ecopetrol’s Comprehensive Waste Management Guide.
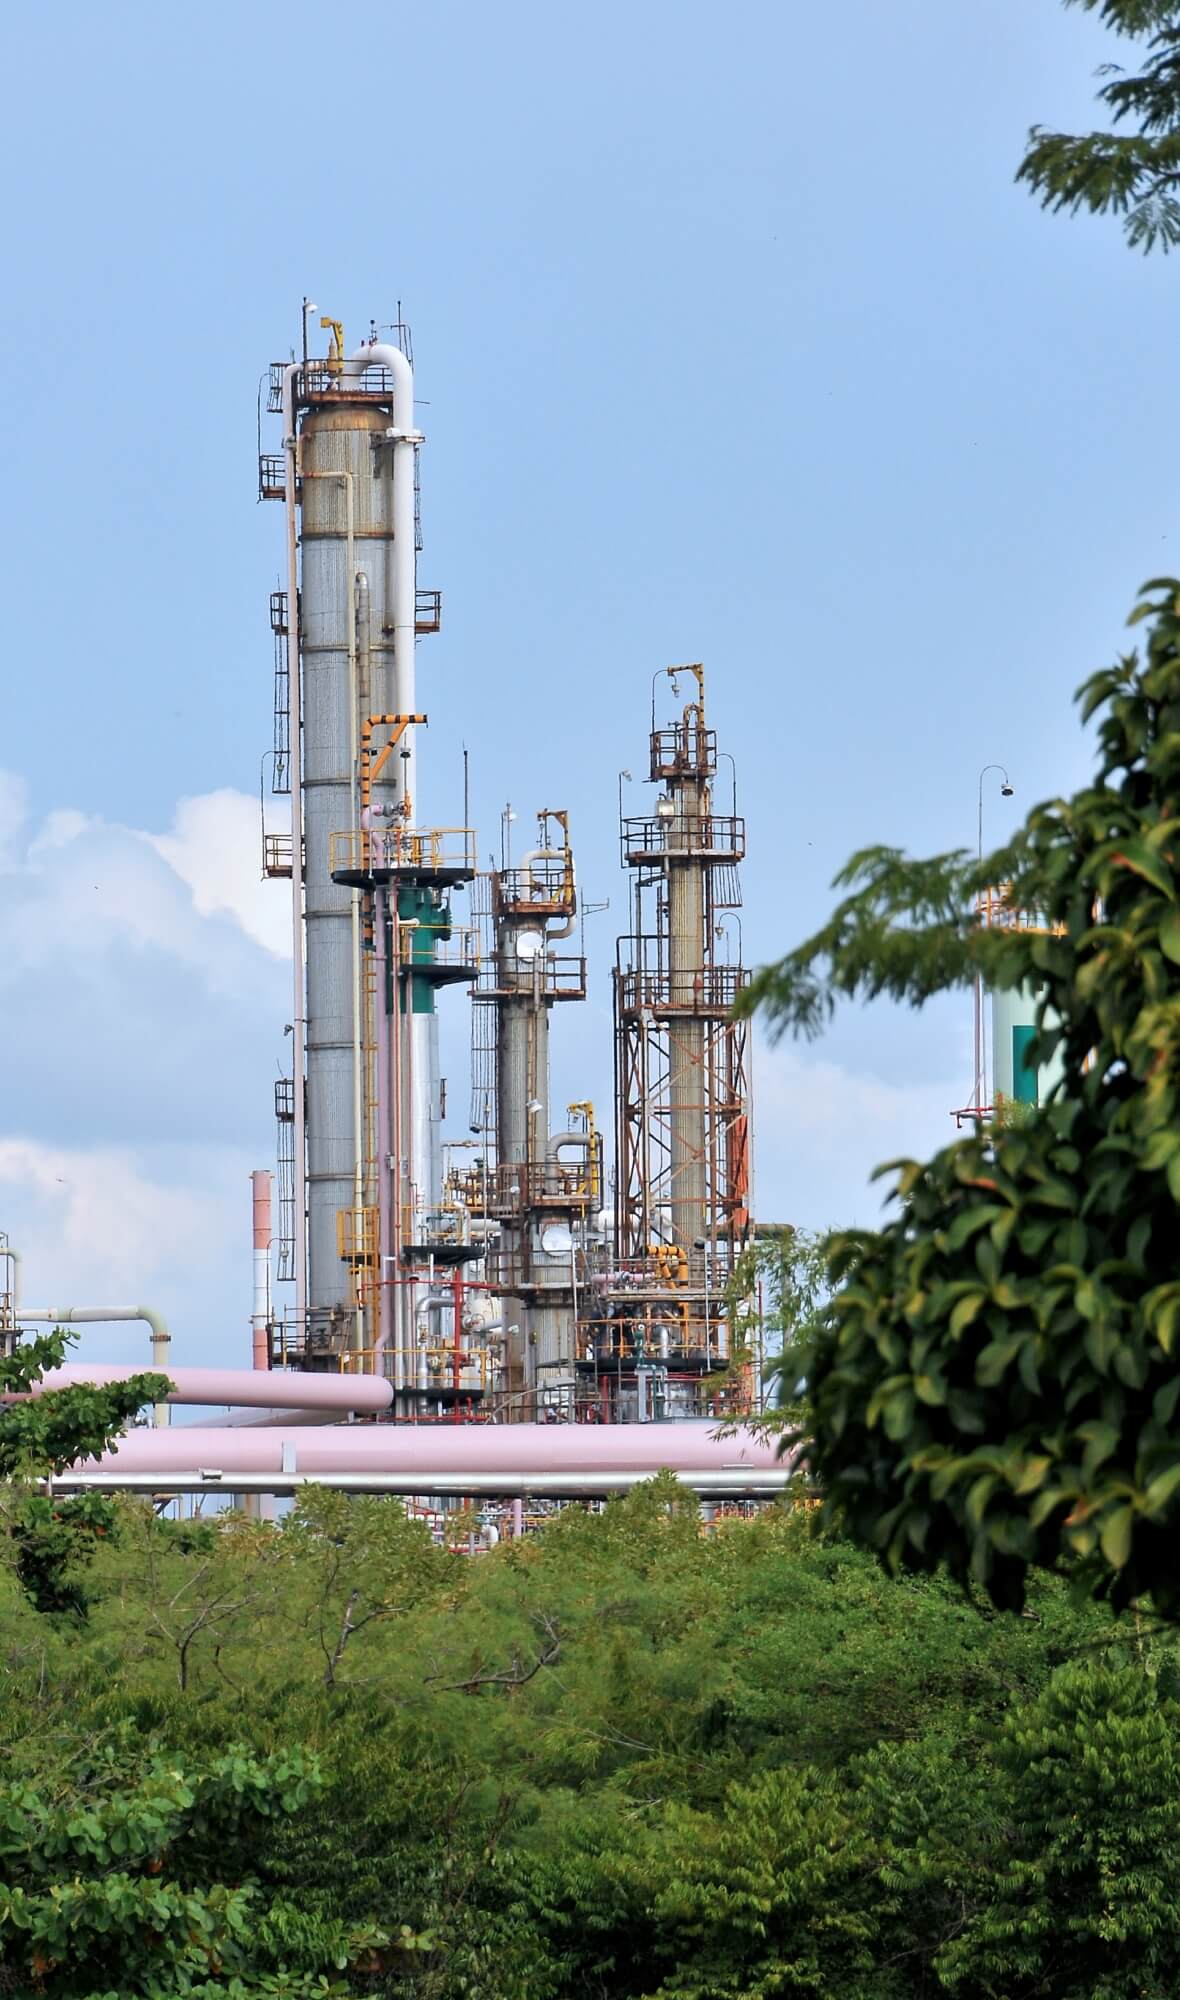
Ecopetrol’s comprehensive waste management is monitored using SIGAR – Waste, digital tool that tracks the amounts generated by each waste stream. This allows the monthly evaluation of hazardous and non- hazardous waste management, the timely identification of opportunities for improvement in management processes, the timely submission of waste generation reports, and the administration of legal management documentation. This information contributes to decision-making and provides the data to be reported.
The SIGAR – Waste Tool allows the following:
Identification and classification of waste.
Administration of storage areas.
Management monitoring and control of the waste generated by the Company and by third parties.
Reports and indicators for decision making and monitoring of waste management processes.
Identification of potential initiatives and/or alternatives for the continuous improvement of the waste management process.
11.3%
reduction of category Y9
oily sludge waste.
84%
utilization of hazardous
waste, not including category Y9 oily sludge.
6%
reduction
of hazardous waste other than oily sludges.
94%
reutilization
of non-hazardous waste.
15%
utilization
of category Y9 oily sludge waste.
15%
utilization
of hazardous waste, not including category Y9 oily sludges.
5%
utilization
of non-hazardous waste.
- Composting of organic waste – 69% circularity index.
- Sale of metal scrap to steel companies – 50% circularity rate.
Waste generated based on its composition
| Waste generated | Unit of measurement | 2018 | 2019 | 2020 | 2021 |
|---|---|---|---|---|---|
| Hazardous waste | TM | 111,737.39 | 203,833.42 | 140,434.13 | 137,375.67 |
| Non-hazardous waste | TM | 178,294.27 | 211,506.16 | 157,700.91 | 199,716.89 |
| Total waste generated | TM | 290,031.66 | 415,339.58 | 298,135.04 | 337,092.56 |
Note: The data reported on hazardous waste in 2019 was adjusted as a result of a quality review, which detected an error in the unit of measurement used during loading. The data reported in 2019 was 319,442.65 tons and decreased to 203,833.42 tons after the review.
In 2021, waste generation accounted for
337,093 tons,
of which 137,376 tons correspond to hazardous waste and 199,717 tons to non-hazardous waste. This represents a 13% increase compared to 2020, mainly due to non-hazardous waste such as debris, metal scrap, water-based drilling cuttings, and clarification sludge from drinking water treatment. The above, due to the restart of activities after the restrictions implemented during the pandemic.
Total waste not intended for disposal based on its composition
(306-4) (WEF 17E)
| Waste not intended for disposal | Unit of measurement | 2018 | 2019 | 2020 | 2021 |
|---|---|---|---|---|---|
| Hazardous waste | Tm | 134.67 | 92.29 | 3,883.72 | 6,105.84 |
| Non-hazardous waste | Tm | 135,118.45 | 201,320.21 | 31,863.13 | 47,565.51 |
| Total waste not intended for disposal | Tm | 135,253.12 | 201,412.5 | 35,746.85 | 53,671.35 |
Note: A quality review of the 2020 data of hazardous waste not intended for disposal identified that the information related to hazardous waste prepared for reutilization and recycled hazardous waste was interchanged, reporting the amounts that went into reutilization as recycled hazardous waste. The amount of hazardous waste prepared for reutilization in 2020 was 3,103.01 tons and the amount that went into recycling was 780.71 tons.
Amount of waste not intended for disposal based on recovery operations at the organization’s facilities
(306-4) (WEF 17E)
| Waste not intended for disposal | Unit of measurement | 2018 | 2019 | 2020 | 2021 |
|---|---|---|---|---|---|
| Total non-hazardous waste not intended for disposal | Tm | 94,440 | 163,861 | 3,158.06 | 13,420 |
Total amount of waste not intended for disposal based on recovery operations in the Company
(305-6) (WEF 17E)
| Items | Unit of measurement | 2018 | 2019 | 2020 | 2021 |
|---|---|---|---|---|---|
| Hazardous waste going to preparation for reutilization | Tm | 11.55 | 9.63 | 3,103.01 | 6,074.62 |
| Recycled Hazardous Waste | Tm | 61.05 | 82.67 | 780.71 | 31.22 |
| Hazardous waste going to recovery operations | Tm | 62.07 | 0 | 0 | 0 |
| Total hazardous waste not intended for disposal | Tm | 134.67 | 92.29 | 3,884.72 | 6,105.84 |
| Non-hazardous waste going into preparation for reutilization | Tm | 94,454.41 | 163,913.13 | 3,171.02 | 13,420.094 |
| Recycled non-hazardous waste | Tm | 34,683.02 | 29,125.14 | 17,861.58 | 27,922.31 |
| Non-hazardous waste going to other recovery operations | Tm | 5,981.01 | 8,281.94 | 10,830.53 | 6,223.11 |
| Total non-hazardous waste not intended for disposal | Tm | 135,118.45 | 201,320.21 | 31,863.13 | 47,565.514 |
| Total waste not intended for disposal | Tm | 135,253.12 | 201,412.5 | 35,746.85 | 53,671.354 |
Note: In 2021, non-hazardous waste going to other recovery operations not intended for disposal showed a decrease compared to 2020, due to reduced generation, mainly of vegetable waste, and to the changes made to the management of wood waste.
Amount of waste not intended for disposal based on recovery operations outside the Company´s facilities
(306-4) (WEF 17E)
| Items | Unit of measurement | 2018 | 2019 | 2020 | 2021 |
|---|---|---|---|---|---|
| Hazardous waste going into preparation for reutilization | Tm | 11.55 | 9.63 | 3,103.01 | 6,074.62 |
| Recycled Hazardous Waste | Tm | 61.05 | 82.67 | 780.71 | 31.22 |
| Hazardous waste going to recovery operations | Tm | 62.07 | 0 | 0 | 0 |
| Total hazardous waste not intended for disposal | Tm | 134.67 | 92.29 | 3,883.72 | 6,105.84 |
| Non-hazardous waste going into preparation for reutilization | Tm | 14.41 | 52.13 | 12.95 | 0.094 |
| Recycled non-hazardous waste | Tm | 34,683.02 | 29,125.14 | 17,861.58 | 27,922.31 |
| Non-hazardous waste going to other recovery operations | Tm | 5,981.01 | 8,281.94 | 10,830.53 | 6,223.11 |
| Total non-hazardous waste not intended for disposal | Tm | 40,678.45 | 37,459.21 | 28,705.06 | 34,145.514 |
There was a
50% increase
of total waste not intended for disposal in 2021 with respect to the data reported in 2020. This is mainly due to the sale of metal scrap (circularity index 50%) stored between March and August 2020 given the state of emergency, and to the greater reutilization of water-based drilling cuttings in 2021 from increased drilling activities.
In addition, 2021 shows a notable increase in the amount of hazardous waste not intended for disposal. This is mainly due to the shipment of more than
57% of the oily sludge
generated at the Barrancabermeja Refinery for reutilization as fuel in cement kilns.
Moreover,
3,020 tons of waste
were used in new internal activities, such as the composting of organic waste from food preparation and vegetable waste, by creating compost bins within the facilities.
Regarding plastic, glass, paper, and cardboard, this waste is properly classified at the source to be offered to recyclers and foundations that use these materials.
During the 2019-2021 period, no hazardous waste was sent to other recovery operations (regeneration). These were intended for reutilization and recycling lines.
Total amount of waste intended for disposal based on its composition
(306-4) (WEF 17E)
| Item | Unit of measurement | 2018 | 2019 | 2020 | 2021 |
|---|---|---|---|---|---|
| Hazardous waste | Tm | 111,602.72 | 203,741.13 | 136,550.41 | 131,269.83 |
| Non-hazardous waste | Tm | 43,175.82 | 10,185.95 | 125,837.78 | 152,153.12 |
| Total waste intended for disposal | Tm | 154,778.54 | 213,927.08 | 262,388.2 | 283,422.95 |
Note: An adjustment was made to the hazardous waste data reported for 2019, after a quality review that identified an error in the unit of measurement used during the data upload process. The hazardous waste generated in 2019 was 319,442.65 tons, which decreased to 203,833.42 tons after the review.
Amount of waste intended for disposal based on disposal operations outside the organization’s facilities
(306-5) (WEF 17E)
| Item | Unit of measurement | 2018 | 2019 | 2020 | 2021 |
|---|---|---|---|---|---|
| Hazardous waste going to incineration (with energy recovery) | Tm | NA | NA | NA | NA |
| Hazardous waste going to incineration (without energy recovery) | Tm | 6,074.9 | 5,754.86 | 2,599.72 | 461.45 |
| Hazardous waste transferred to landfills | Tm | 16,641.99 | 6,012.07 | 30,209.79 | 6,034.52 |
| Hazardous waste going to other disposal operations | Tm | 88,885.83 | 191,974.2 | 103,740.91 | 124,773.86 |
| Total hazardous waste intended for disposal | Tm | 111,602.72 | 203,741.13 | 136,550.41 | 131,269.83 |
| Non-hazardous waste going to incineration (with energy recovery) | Tm | NA | NA | NA | NA |
| Non-hazardous waste going to incineration (without energy recovery) | Tm | 102.21 | 92.47 | 45.56 | 2.37 |
| Non-hazardous waste transferred to landfills | Tm | 43,073.61 | 10,093.49 | 125,792.22 | 94,729.72 |
| Non-hazardous waste going to other disposal operations | Tm | 5,7421.03 | |||
| Total non-hazardous waste intended for disposal | Tm | 43,175.82 | 10,185.95 | 125,837.78 | 152,153.12 |
Note: Ecopetrol does conduct waste disposal operations within its facilities.
Total amount of waste intended for disposal based on disposal operations in the organization
(306-5) (WEF 17E)
| Item | Unit of measurement | 2018 | 2019 | 2020 | 2021 |
|---|---|---|---|---|---|
| Hazardous waste going to incineration (with energy recovery) | Tm | NA | NA | NA | NA |
| Hazardous waste going to incineration (without energy recovery) | Tm | 6,074.9 | 5,754.86 | 2,599.72 | 461.45 |
| Hazardous waste transferred to landfills | Tm | 16,641.99 | 6,012.07 | 30,209.79 | 6,034.52 |
| Hazardous waste going to other disposal operations | Tm | 88,885.83 | 191,974.2 | 103,740.91 | 124,773.86 |
| Total hazardous waste intended for disposal | Tm | 111,602.72 | 203,741.13 | 136,550.41 | 131,269.83 |
| Non-hazardous waste going to incineration (with energy recovery) | Tm | NA | NA | NA | NA |
| Non-hazardous waste going to incineration (without energy recovery) | Tm | 102.21 | 92.47 | 45.56 | 2.37 |
| Non-hazardous waste transferred to landfills | Tm | 43,073.61 | 10,093.49 | 125,792.22 | 94,729.72 |
| Non-hazardous waste going to other disposal operations | Tm | 5,7421.03 | |||
| Total non-hazardous waste intended for disposal | Tm | 43,175.82 | 10,185.95 | 125,837.78 | 152,153.12 |
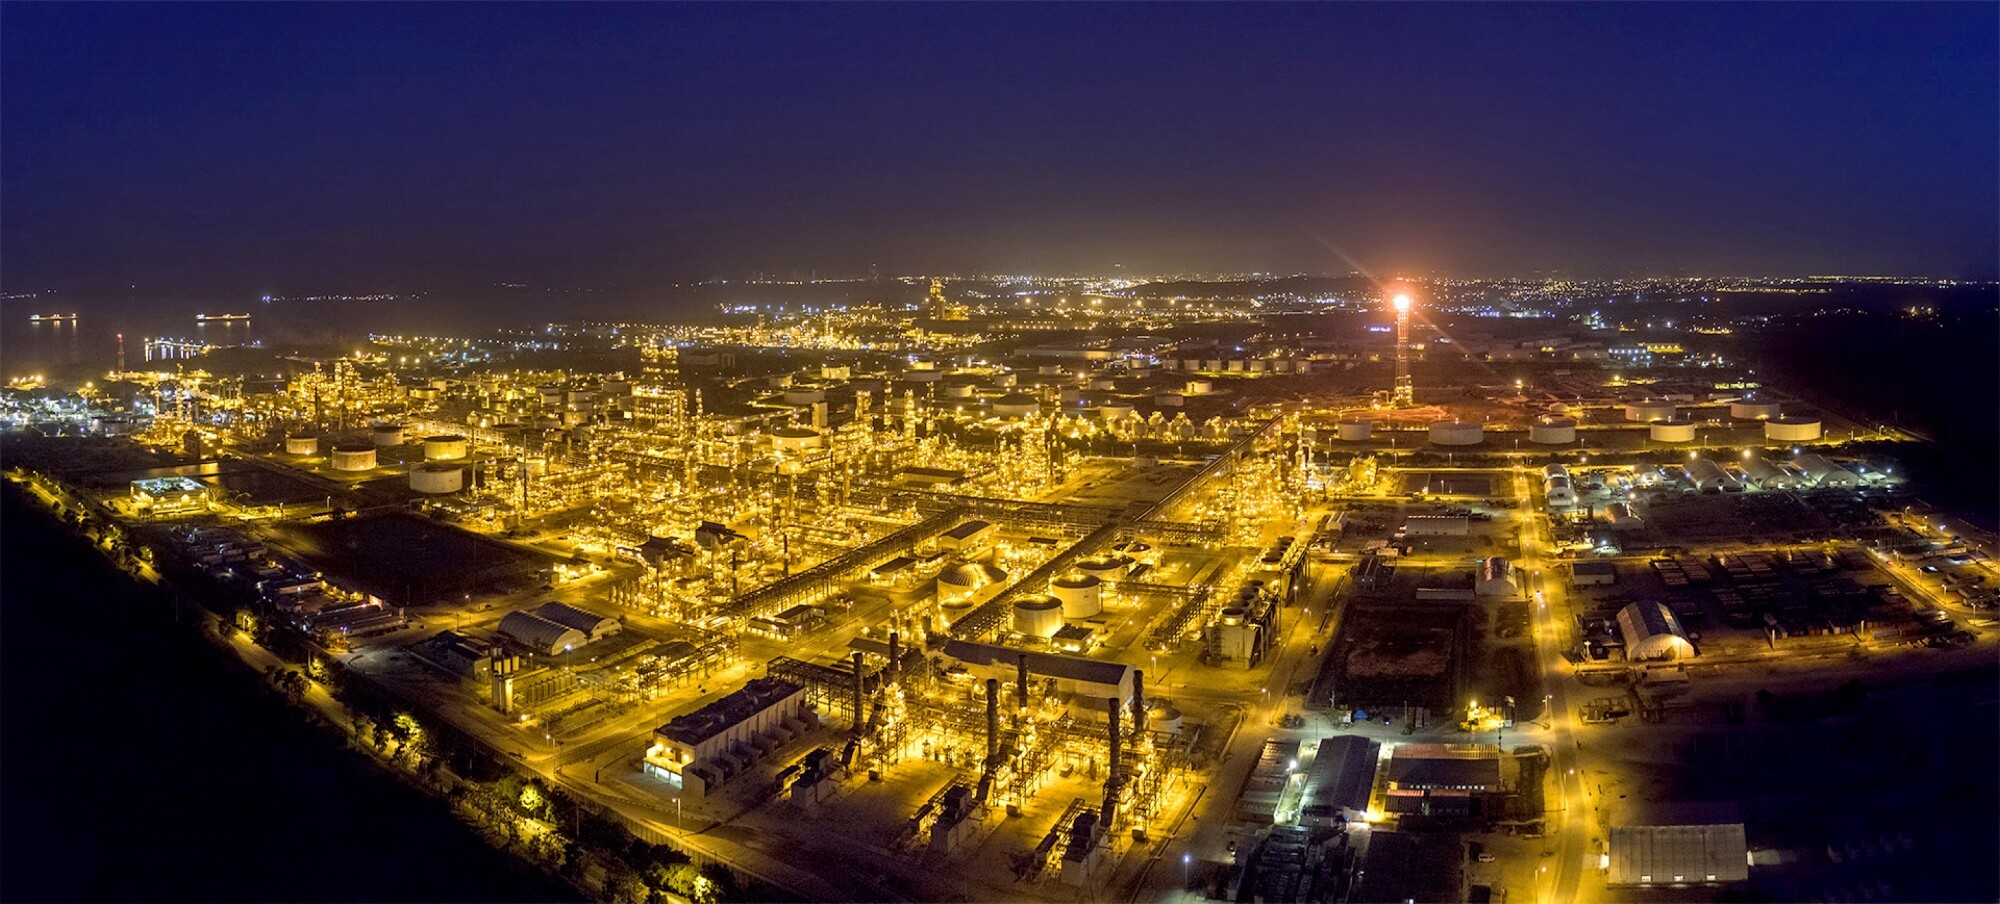
Waste management by operations
(306-2) (WEF 12E)
| Item | Unit of measurement | 2018 | 2019 | 2020 | 2021 |
|---|---|---|---|---|---|
| a) Total waste generated | Tm | 178,294.27 | 211,506.16 | 157,700.91 | 199,716.89 |
| b) Total waste used/recycled/sold | Tm | 135,118.45 | 201,320.21 | 31,863.13 | 47,565.51 |
| Total waste eliminated (AB) | Tm | 43,175.82 | 10,185.95 | 125,837.78 | 152,151.38 |
(306-5)) (WEF 17E)
In accordance with the provisions of the Comprehensive Waste Management Guide, the management stages initially verify whether the waste is suitable for use. If there are no treatments available on the market to utilize the waste due to its physicochemical composition, it is sent for elimination or final disposal.
- Debris
- HC impregnated elements
- Catalysts
- Used filters
- Oily sludge
Finally, there was an increase in the disposal of this waste in 2020, given that some third-party treatments and operations were suspended due to the state of emergency arising from COVID 19, thereby leaving the only option of disposing this waste in security cells. This situation returned to normal in 2021, with the activation of the aforementioned co-processing contracts.

